23 MIN READ·APRIL 2, 2026
The Stagflation Threshold
MR
CO-FOUNDER · MARKET RADAR

The economy looks strong. Retail sales beat. Manufacturing is expanding. Claims haven't budged. Our own growth index is printing some of the strongest readings of the year. By every backward-looking measure available, you would think "The Bull Case" we published a month ago was playing out exactly as described.
None of that matters if inflation eats it alive.
That is what this piece is about. Not a recap of what happened, because you already know what happened. This is about the path from where we are now to where we think we are heading: a stagflationary regime that the Federal Reserve has no tools to prevent and no willingness to acknowledge. We are going to walk through the oil shock and why it is fundamentally different from anything the Fed has faced in this cycle, the race between our growth and inflation indices and why inflation is winning that race in a way that is not yet visible in the headlines, the $690 billion AI capex flywheel that has been quietly propping up the entire growth story and why it is more fragile than anyone wants to admit, the financial sector cracks that were forming well before a single bomb fell on Iran, and what all of it means for positioning over the next 30 to 45 days. A month ago we named Stagflation as the one thing that kills the bull case. That framework has not changed. What changed is the probability. A month ago it was a tail risk. Today it is a plausible base case.
A quick note on where we sit before we get into the analysis. When we published that bull case in early March, we were fully allocated to TQQQ. The regime read Inflation, Risk-On. The growth trend was bullish. Everything was aligned. The morning after we published, February payrolls printed negative 92,000 against a consensus of roughly 60,000 positive. The Nasdaq trend broke on the close that Friday, and our system, which requires both the macro regime and the price trend to agree before holding a position, sold our entire TQQQ allocation. With our standard implementation delay, we were fully repositioned into cash by Monday, March 9th. Everything that followed, the Hormuz closure, the oil spike to $112, the Nasdaq entering correction, three straight weekly declines on the S&P, inflation swaps repricing, the Fed going from pricing rate cuts to pricing a 51% probability of a hike by March 2027, all of it happened with us sitting in cash. We bring this up not to take a victory lap but because it matters for how you read the rest of this piece. We are not writing from a position of hope or fear. We are writing from a position of capital preservation, looking forward at the data and trying to determine what comes next.
This Oil Shock Is Supply-Side. The Fed Cannot Fix It.
This distinction matters more than anything else we are going to discuss, so we want to make sure it lands clearly before we move on to the model readings and the data.
The inflation that peaked in 2022 was driven primarily by excess money supply. The government pumped trillions into the economy during COVID, consumers spent it, and prices surged because there was simply too much money chasing too few goods. This was publicly masked as a "supply shortage from COVID lockdowns", but in reality, simply increasing money in circulation by over 30% can do wondrous things. The Fed addressed that problem by hiking rates aggressively, draining liquidity out of the system, and letting the labor market absorb the pain. It was brutal, but it worked, because the Fed has tools that are specifically designed to manage demand-driven inflation. When you raise the cost of borrowing, people borrow less and spend less, and eventually prices come back down. The entire 2022-2024 tightening cycle was built on this logic, and the results spoke for themselves.
This time the problem is not that people are spending too much. It is that the physical infrastructure that produces and ships energy has been destroyed. Refineries have been bombed. LNG processing facilities are gone. Iran's missile strikes on Qatar's Ras Laffan complex, which handles roughly 20% of the world's LNG supply, knocked out 17% of the country's export capacity in a single attack. Two of Qatar's fourteen liquefaction trains and one gas-to-liquids facility were damaged, sidelining 12.8 million tonnes of annual LNG production for an estimated three to five years. QatarEnergy declared force majeure on long-term supply contracts with customers in Italy, Belgium, South Korea, and China, meaning those countries are not getting their contracted energy deliveries and have no timeline for when they will. France's finance minister confirmed that 30 to 40 percent of total Gulf refining capacity has been destroyed, with 11 million barrels per day taken completely offline. The IEA described the overall supply disruption as worse than the 1970s oil shocks and the 2022 Russia-Ukraine crisis combined. Operation Epic Fury launched in late February, the IRGC closed the Strait of Hormuz by March 2, Houthis entered the war shortly after, and Brent crude crossed $112. Gas at the pump hit $4.06, up more than a third from pre-war levels.
None of these barrels come back when a ceasefire is signed. A peace deal does not un-bomb a refinery. Damaged liquefaction trains take three to five years to repair. Destroyed refining capacity takes even longer. This is permanent supply removal, and the timeline for restoration extends well beyond any diplomatic outcome that is remotely plausible right now.
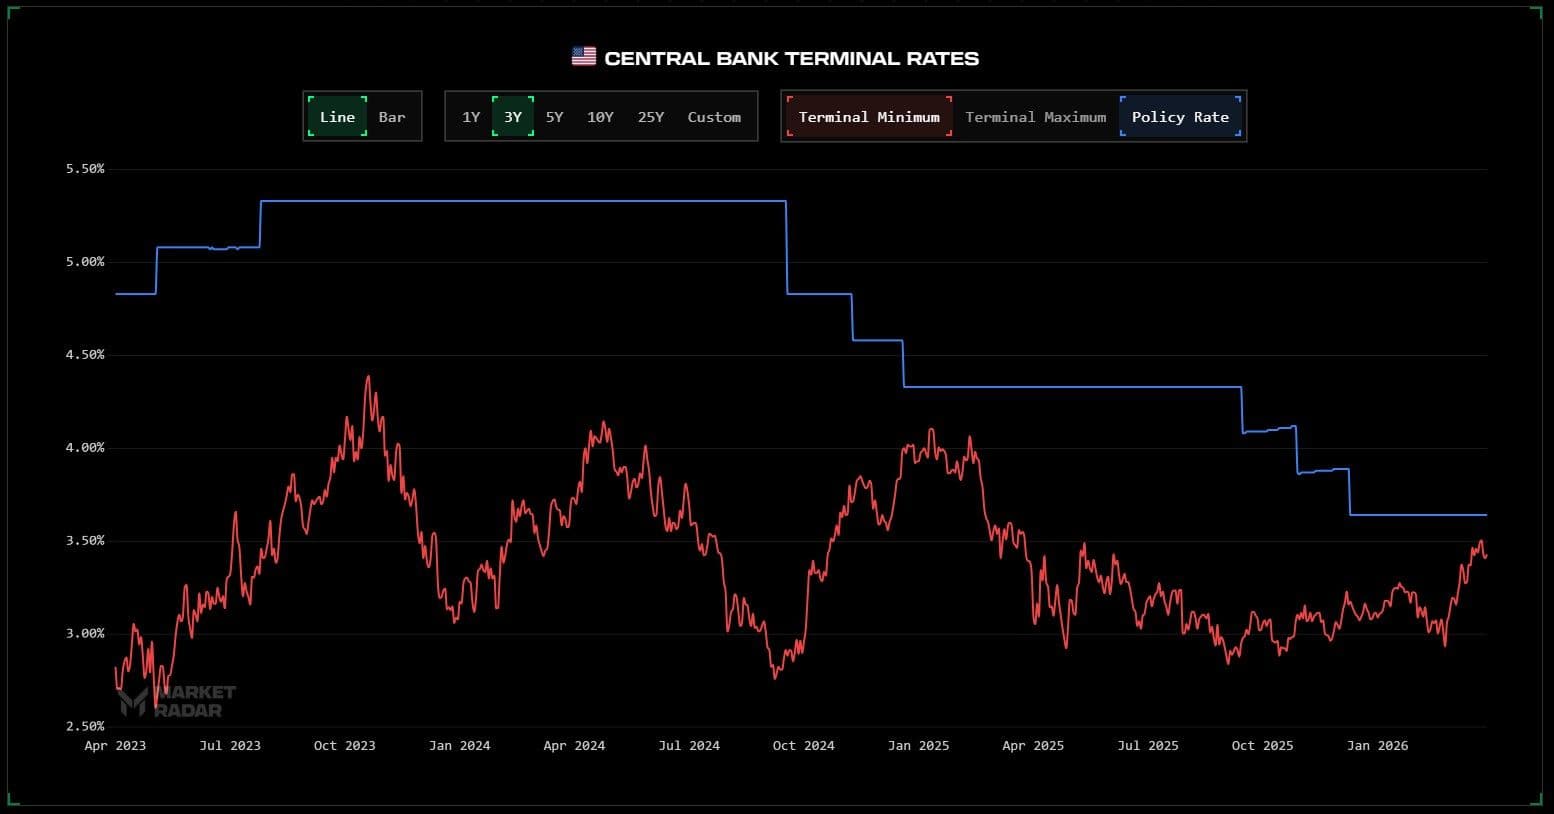
And the Fed cannot do a thing about any of it. The Fed cannot print oil. Hiking rates does not rebuild a refinery. It does not reopen a shipping lane. It does not put 11 million barrels a day back on the water. The only option the Fed has in this environment is to hold rates where they are and watch the damage accumulate, or to cut rates if and when the supply shock destroys enough consumer demand that it metastasizes into more negative growth impulses. Powell held rates at 3.50 to 3.75% at the March 18 FOMC and described the current stance as "modestly restrictive." The vote was 11 to 1. Governor Miran, who has been the most vocal advocate for rate cuts this year, was the lone dissent. But the more revealing signal came from Governor Waller, who had actually dissented in favor of a rate cut back in January and flipped to voting hold this time around. When the most dovish voice on the entire board goes quiet while the labor market is printing negative 92,000 jobs, the institutional message becomes clear that inflation has taken priority over everything else, and the central bank has chosen to stand still in the middle of a supply crisis it has no tools to address.
That is the backdrop for everything that follows.
The Race Between Growth and Inflation
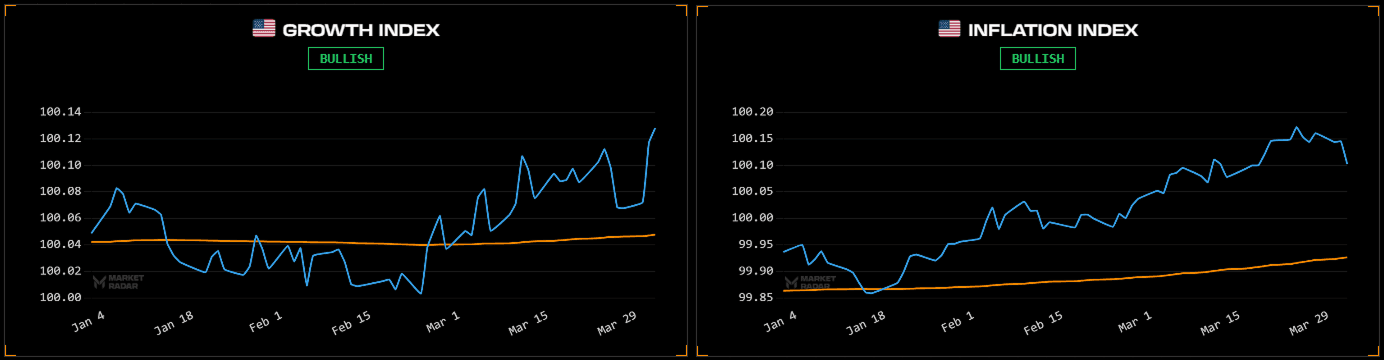
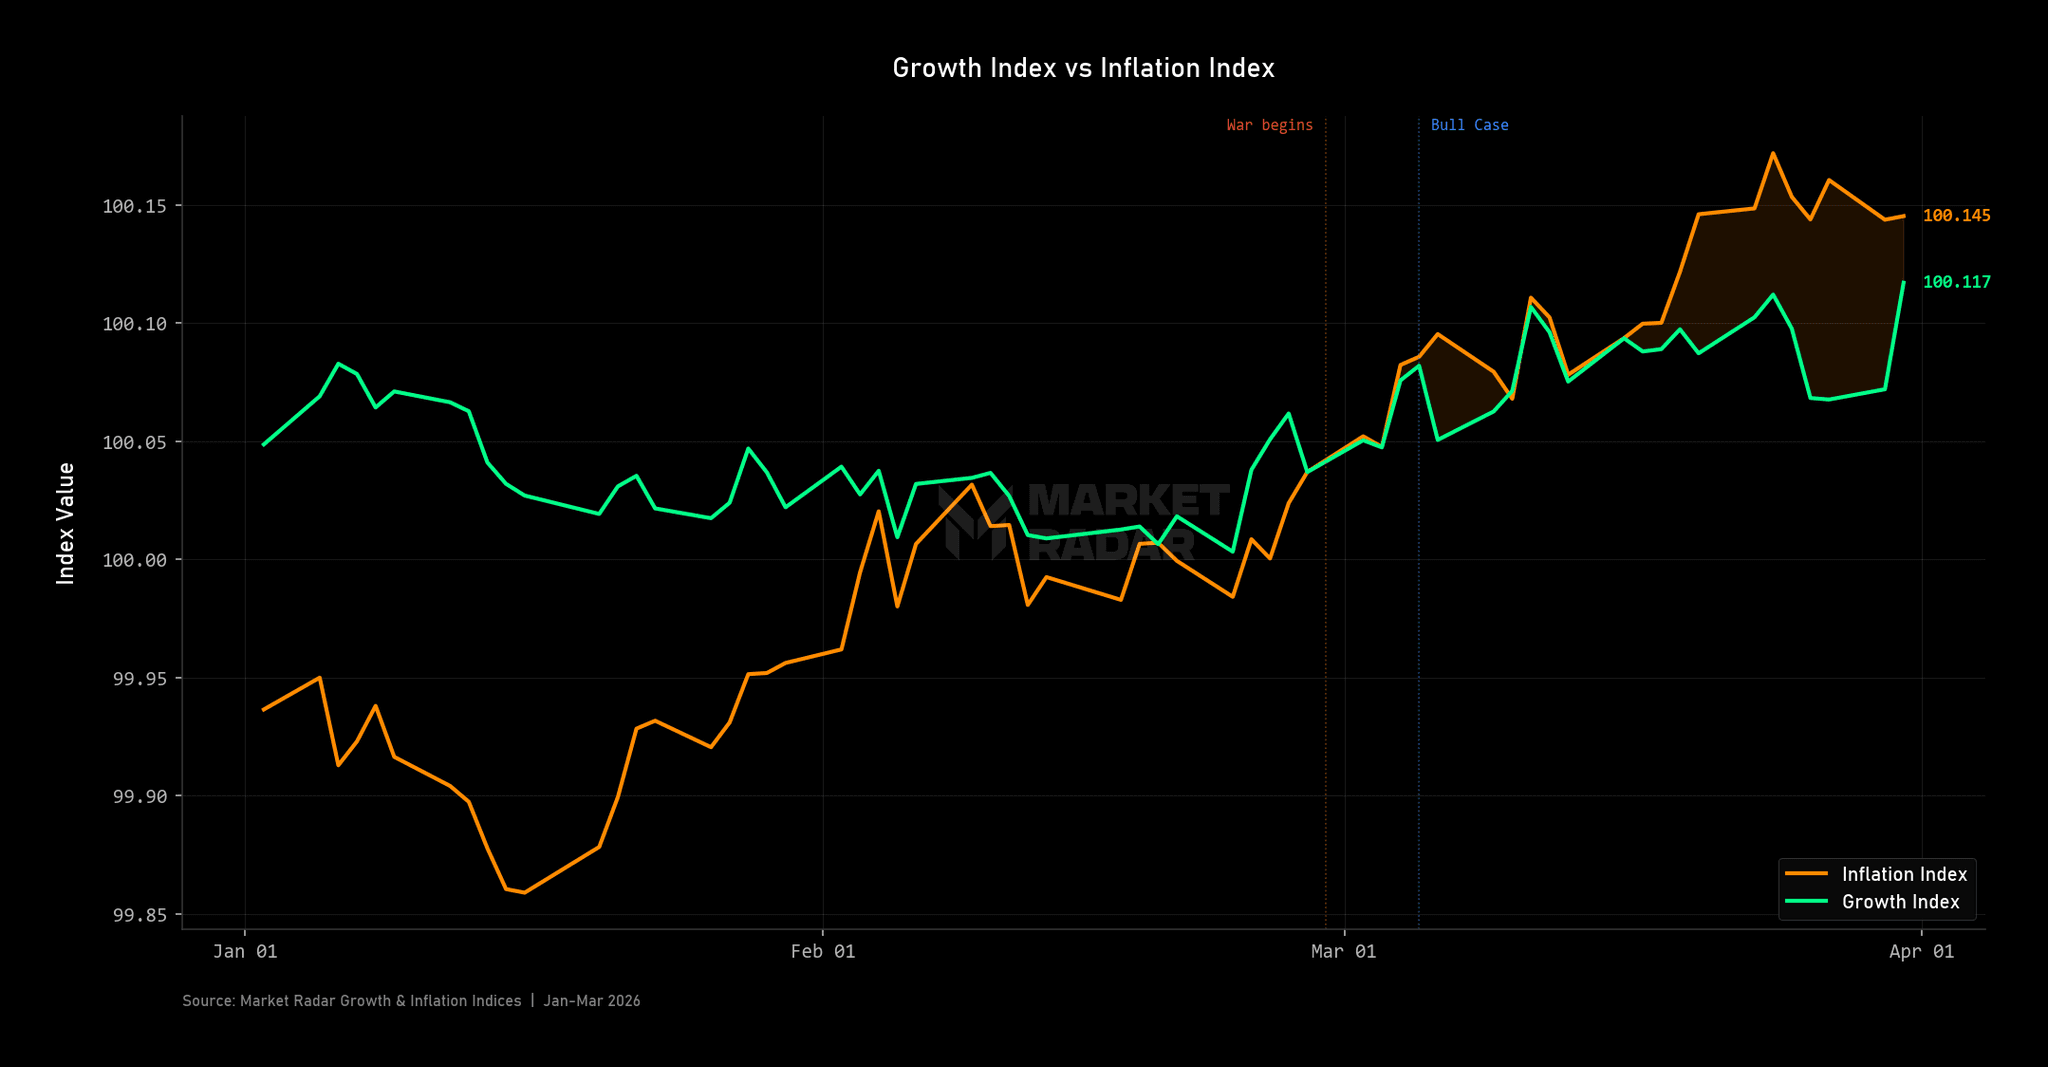
Our regime model is built around a simple idea: track the momentum behind growth expectations and the momentum behind inflation expectations, and let the relationship between those two forces tell you what kind of economy you are in. When both are accelerating, the economy is in what we call the Inflation regime. Prices are rising, but so is economic activity, and risk assets tend to do well because earnings growth is keeping pace with costs. When growth starts decelerating while inflation continues to accelerate, the economy crosses into Stagflation, which is the worst possible environment for markets because you get the pain of rising costs without the earnings growth to absorb them. That crossover is the threshold we named in "The Bull Case" as the one thing that kills the bullish thesis.
As of March 31, both indices are still positive. Growth index is at 100.117. Inflation index is higher at 100.145. Both are trending bullish. If you stopped there, you would conclude that everything is fine. The model says Risk-On and growth is strong. What is the problem?
The problem is the trajectory. In early January, the growth index was sitting around 100.05 while the inflation index was below it at roughly 99.86. Growth was actually leading inflation. The economy was expanding faster than prices were rising, which is the healthiest possible configuration. By early February, as the conflict started to escalate, the inflation index crossed above the growth index for the first time. And since the war fully escalated in late February, the two lines have diverged dramatically. The inflation index has surged from around 100.05 to 100.145, a sharp and sustained acceleration driven by the oil shock. The growth index, meanwhile, has barely moved at all, oscillating in a narrow band between 100.00 and 100.12 for the entire three-month period.
That divergence is how every stagflationary transition in our model's history has started. It does not happen all at once. It plays out in phases. The first phase is what we are experiencing right now: inflation outpacing growth while both indices are still positive. The regime still reads Inflation, Risk-On, because both forces are technically moving in the right direction. But underneath the surface, the balance of power has shifted. The second phase begins when the sustained cost pressure from high energy prices starts to bite through the real economy. Consumers pull back on discretionary spending because their fuel bills are eating into their budgets. Corporate margins compress because input costs are rising faster than companies can pass them through. Hiring slows because businesses lose visibility on demand. The growth index starts to roll over, and the bullish trend begins to wobble. The third phase is the crossover itself: growth falls into negative territory while inflation holds, the regime transitions from Inflation to Stagflation, and the risk dynamic flips from Risk-On to Risk-Off.
We are in phase one. Growth positive but flat. Inflation positive and accelerating. And the oil shock that is driving the divergence is barely a month old.
How $4 Gas Becomes a Growth Problem
The mechanism here is not complicated. But it plays out slowly enough that most people miss it until the damage is already visible in the rearview mirror, and by then it is too late to position for it.
Gas at $4.00 a gallon is a tax. It does not show up on a pay stub, but the economic effect is the same: money that would have gone to restaurants, to retail, to entertainment, to basically any discretionary purchase you can think of, goes to the pump instead. When that tax lasts a couple of weeks, consumers absorb it by cutting back on a few things at the margins and life goes on. When it lasts months, as this one will given the structural nature of the supply destruction, behavior changes in ways that compound through the entire economy. People consolidate trips. They eat out less frequently. They defer the purchase they were planning to make. Multiply those individual decisions by tens of millions of households and you get a measurable drag on consumer spending, which is the single largest component of US GDP.
The corporate side compounds the problem further. Rising energy costs do not just hit consumers at the pump. They flow through to every link in the supply chain: shipping costs, packaging costs, raw material costs, heating and cooling costs for every commercial building in the country. Margins compress even if revenue holds steady, and when margins compress, businesses respond the way they always do: they defer investment, slow hiring, and wait for visibility. That is how an inflation shock that starts in the energy sector metastasizes into a broad-based growth problem.
The effects are already spreading well beyond the gas pump, and this is where the scale of this particular shock starts to become clear. Roughly one-third of the world's fertilizer trade passes through the Strait of Hormuz, and that traffic has effectively stopped. Urea prices in the US Gulf have nearly doubled since the start of the year, from $350 per ton to over $800. Farmers heading into spring planting are reporting that fertilizer suppliers will not even commit to a price. An Illinois farmer told CNBC that he could not get a quote on any nitrogen source at any price. A Tennessee farmer told a separate outlet that he expects to pay $100,000 more for fertilizer this year than last, a 40% increase on a cost that is already one of the largest line items in agricultural production. This will turn into an agricultural supply chain story, a food inflation story, and a rural economy story, all compounding at once. And we are only one month into this shock.
The Data Looks Strong Because It Is Looking Backwards
This is the trap. And we think a lot of people are falling into it.
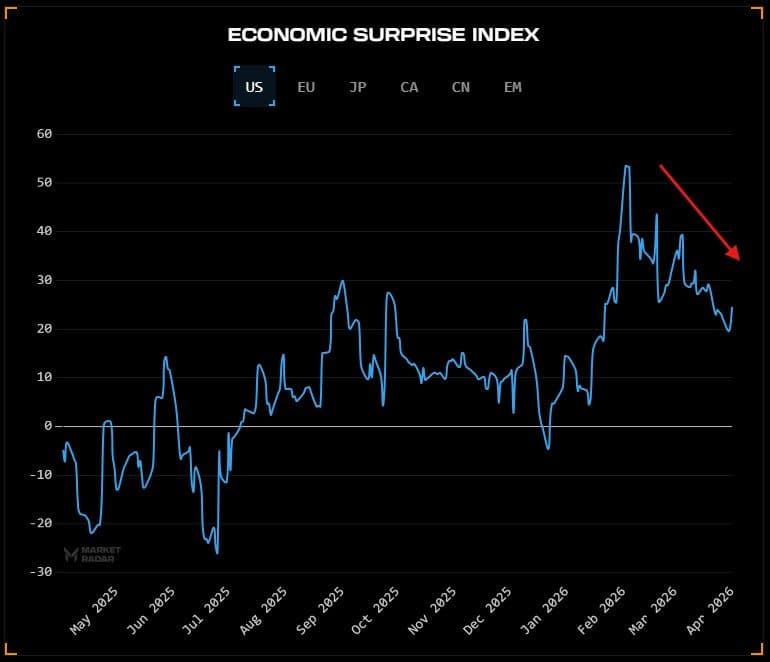
The hard data released over the past month looks resilient. February retail sales came in at +0.6% versus a +0.5% consensus, with the control group beating at +0.5% versus +0.3%. March ADP private payrolls printed 62,000 against a projection of 40,000. ISM Manufacturing held in expansionary territory at 52.4. Initial jobless claims have not budged from the 210,000 level they have been anchored at for months. The Economic Surprise Index sits at +22.1, which means that, in aggregate, the data is still coming in better than economists expected.
Nearly all of this data was collected before the full weight of the oil shock hit the real economy. The February retail sales number captured consumer spending behavior before gas hit $4.06. The ISM Manufacturing survey was conducted before oil was sustainably above $100. The payroll data reflects hiring decisions that were made weeks before the war's economic impact was visible in corporate planning cycles. What we are looking at in the rearview mirror is a pre-shock economy. It tells us where we were. It does not tell us where we are going. And the relevant question is what the economy looks like after it has absorbed a full quarter of $4+ gas, $100+ oil, doubled fertilizer prices, and compressed corporate margins, and we are only about one month into that process.
The forward-looking signals, the ones that measure expectations rather than backward receipts, are already diverging sharply from the hard data. Consumer sentiment finalized at 53.3 in March, declining for the third consecutive month. The Conference Board expectations index dropped to 70.9, and it has now been below the recessionary threshold of 80 for 14 consecutive months, the longest sustained run below that level since the 2008 financial crisis. Short-term inflation expectations in the Michigan survey jumped to 3.8%, the highest reading since 2022. When consumers expect prices to keep rising, their behavior changes in ways that feed directly back into the growth picture. They pull forward purchases to beat future price increases, which creates a temporary sugar high followed by a spending cliff. They cut discretionary spending. They demand higher wages, which compresses margins further. This is the forward shock being priced in by the people who actually have to live with $4 gas and doubled grocery bills, while the hard data is still reflecting a world that no longer exists.
The AI Flywheel That Is Propping Up Growth
There is a specific reason the backward data looks as strong as it does, and once you see it, the growth picture changes completely.
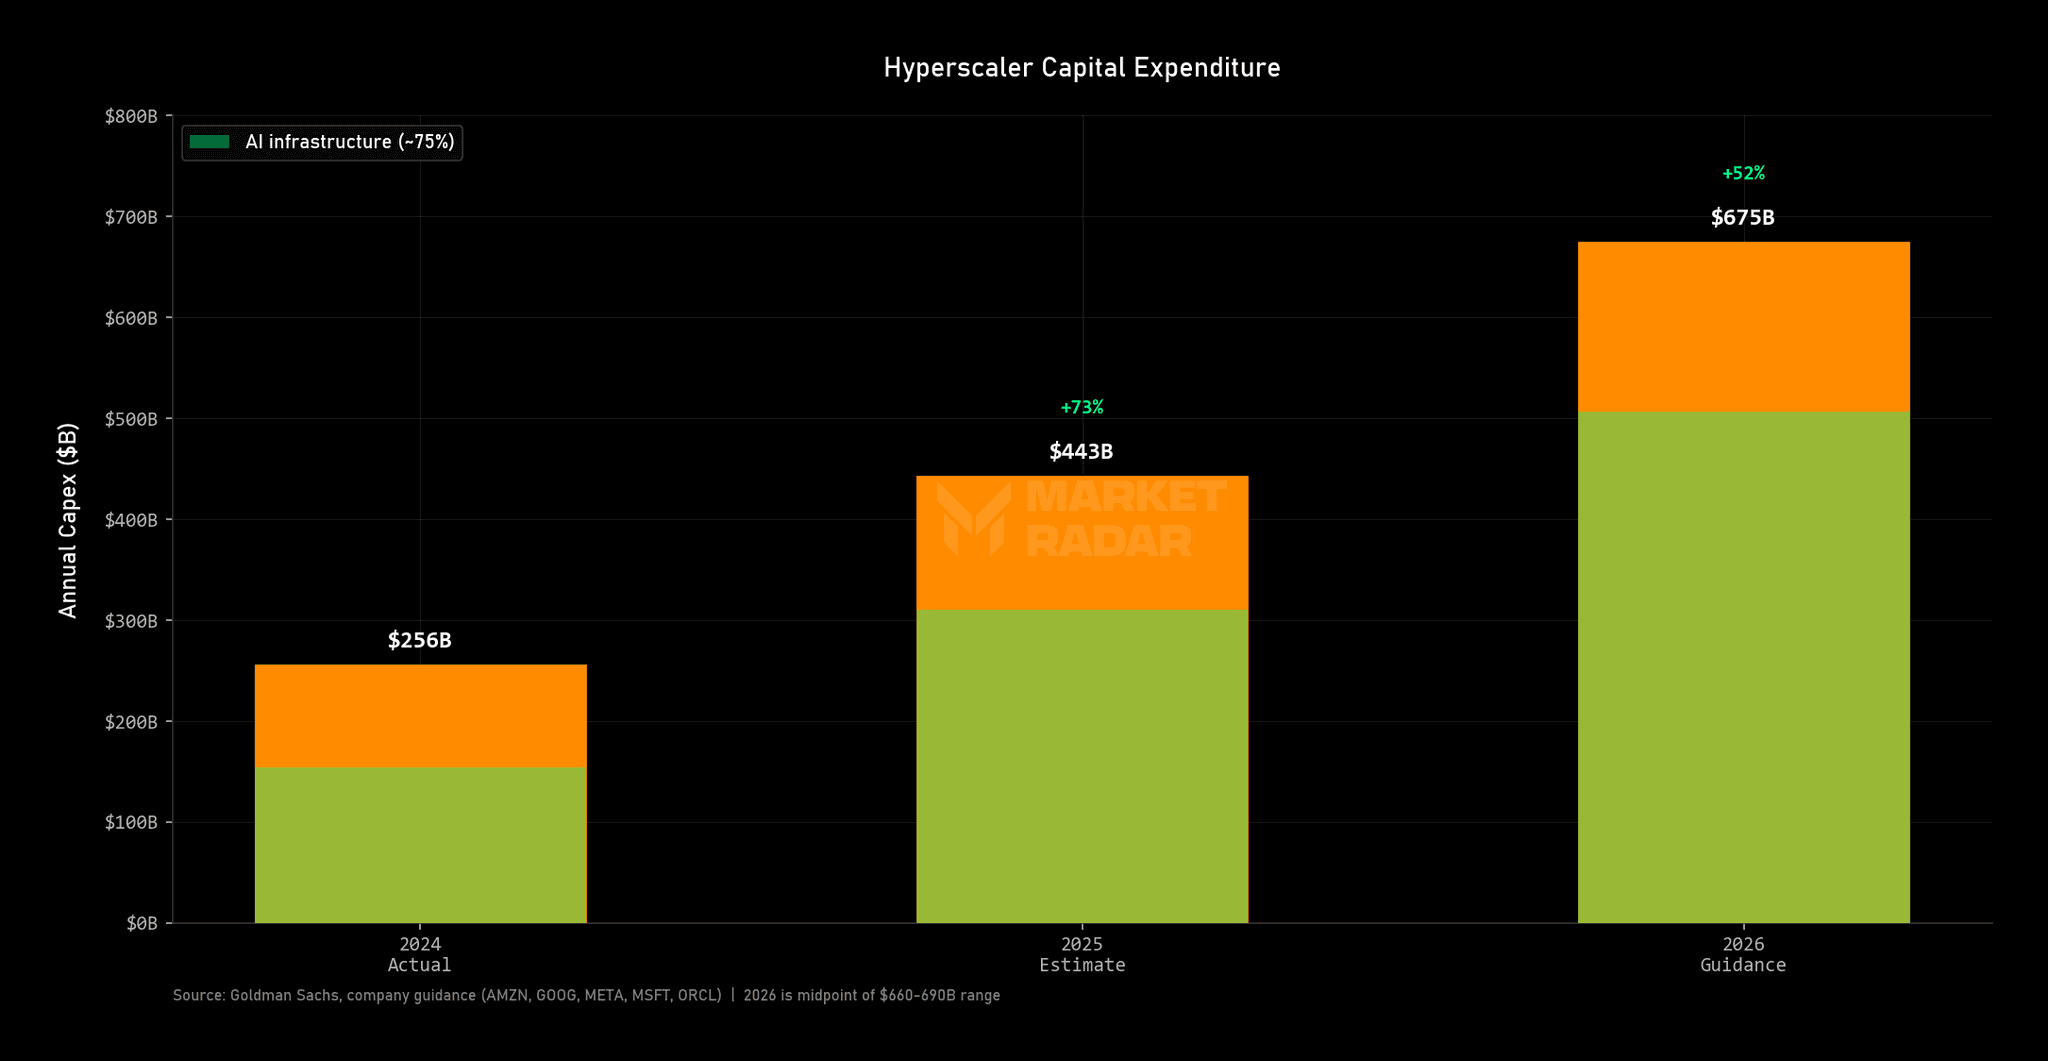
In the first half of 2025, technology-related capital expenditure, information processing equipment, software, R&D, contributed 2.28 percentage points to GDP growth. That number is worth sitting with for a second. It surpassed consumer spending. Technology capex became the single largest engine of economic growth in America for the first time in recent history. A year earlier, the same category contributed just 0.56 percentage points. That is a fourfold increase in twelve months, and it was driven almost entirely by one thing: the buildout of AI infrastructure.
Hyperscaler capex, the combined spending of Amazon, Alphabet, Meta, Microsoft, and Oracle, is projected between $660 billion and $690 billion in 2026. That is two and a half times the $256 billion these same companies spent in 2024. Roughly 75% of that total is flowing directly into AI-related infrastructure. Monthly US data center construction spending hit $45.1 billion by December 2025, an 85% increase in just two years. Hyperscaler budgets now represent approximately 2.2% of US GDP. On the employment side, data center construction has created 650,000 jobs, a 30% increase from 501,000 in 2023, and the industry needs an additional 349,000 workers this year alone just to keep pace with the buildout schedule. Construction workers on data center projects earn an average of $81,800 annually, which is 32% more than comparable workers on non-data-center construction sites. Electricians and HVAC engineers working on these projects are commanding six-figure salaries, and the country faces a shortage of 81,000 electricians per year.
🚀 Join the Radar Community
Get free access to MacroBase and notifications about new posts and updates.
This is the flywheel that has been holding the growth picture together. Hundreds of thousands of workers earning premium wages on data center construction sites, spending those wages into the local economy on housing, retail, services, and everything else that keeps communities running. A large portion of US GDP growth is being kept alive by AI spending with no guaranteed return. If you strip out the AI capex contribution from the GDP numbers, the economy underneath looks considerably weaker than the headline figures suggest.
But flywheels work in both directions. The same forces that accelerate them on the way up can crush them on the way down. And the forces that sustained this one are deteriorating fast. The Nasdaq is in correction. Every single member of the Magnificent 7 is in a double-digit drawdown from its all-time high, with Microsoft down more than 30% and the group collectively shedding over $2 trillion in market cap. These are the same companies that committed $690 billion in forward capex when their stocks were near all-time highs, when risk appetite was expansive, and when the narrative that "AI demand is infinite" was accepted without question. That environment no longer exists. Equity prices are falling, which compresses the risk appetite and the financing capacity that justified the spending in the first place. Boards and shareholders that signed off on $200 billion in capex commitments when the stock was at record highs start asking very different questions when the stock is in a 20% drawdown. Credit conditions are tightening, which makes project financing more expensive. And the narrative itself is shifting from unbounded optimism toward caution, toward deferring projects, toward waiting for better visibility before breaking ground on the next facility.
Goldman published research on this that we think is underappreciated. They found no meaningful relationship between AI adoption and productivity at the macro level. The net GDP impact of this entire capex cycle is only 0.1 to 0.2 percentage points once you strip out imported capital goods. Read that again. The growth contribution showing up in the headline numbers is being driven by the spending, not by the returns. The spending itself is the product. And that distinction is everything, because spending that generates measurable returns gets protected when times get tough. Spending that does not, gets cut. Always.
If those capex commitments start getting trimmed, even at the margins, the hundreds of thousands of construction workers, electricians, and engineers earning premium wages on those sites will feel it immediately. The labor market stimulus that has been masking whatever underlying weakness exists in the broader economy does not gently taper off. It contracts. And the growth index that has been riding this flywheel through a war, an oil shock, and a market correction simultaneously, loses the engine that was keeping it aloft.
The Cracks That Were Already There
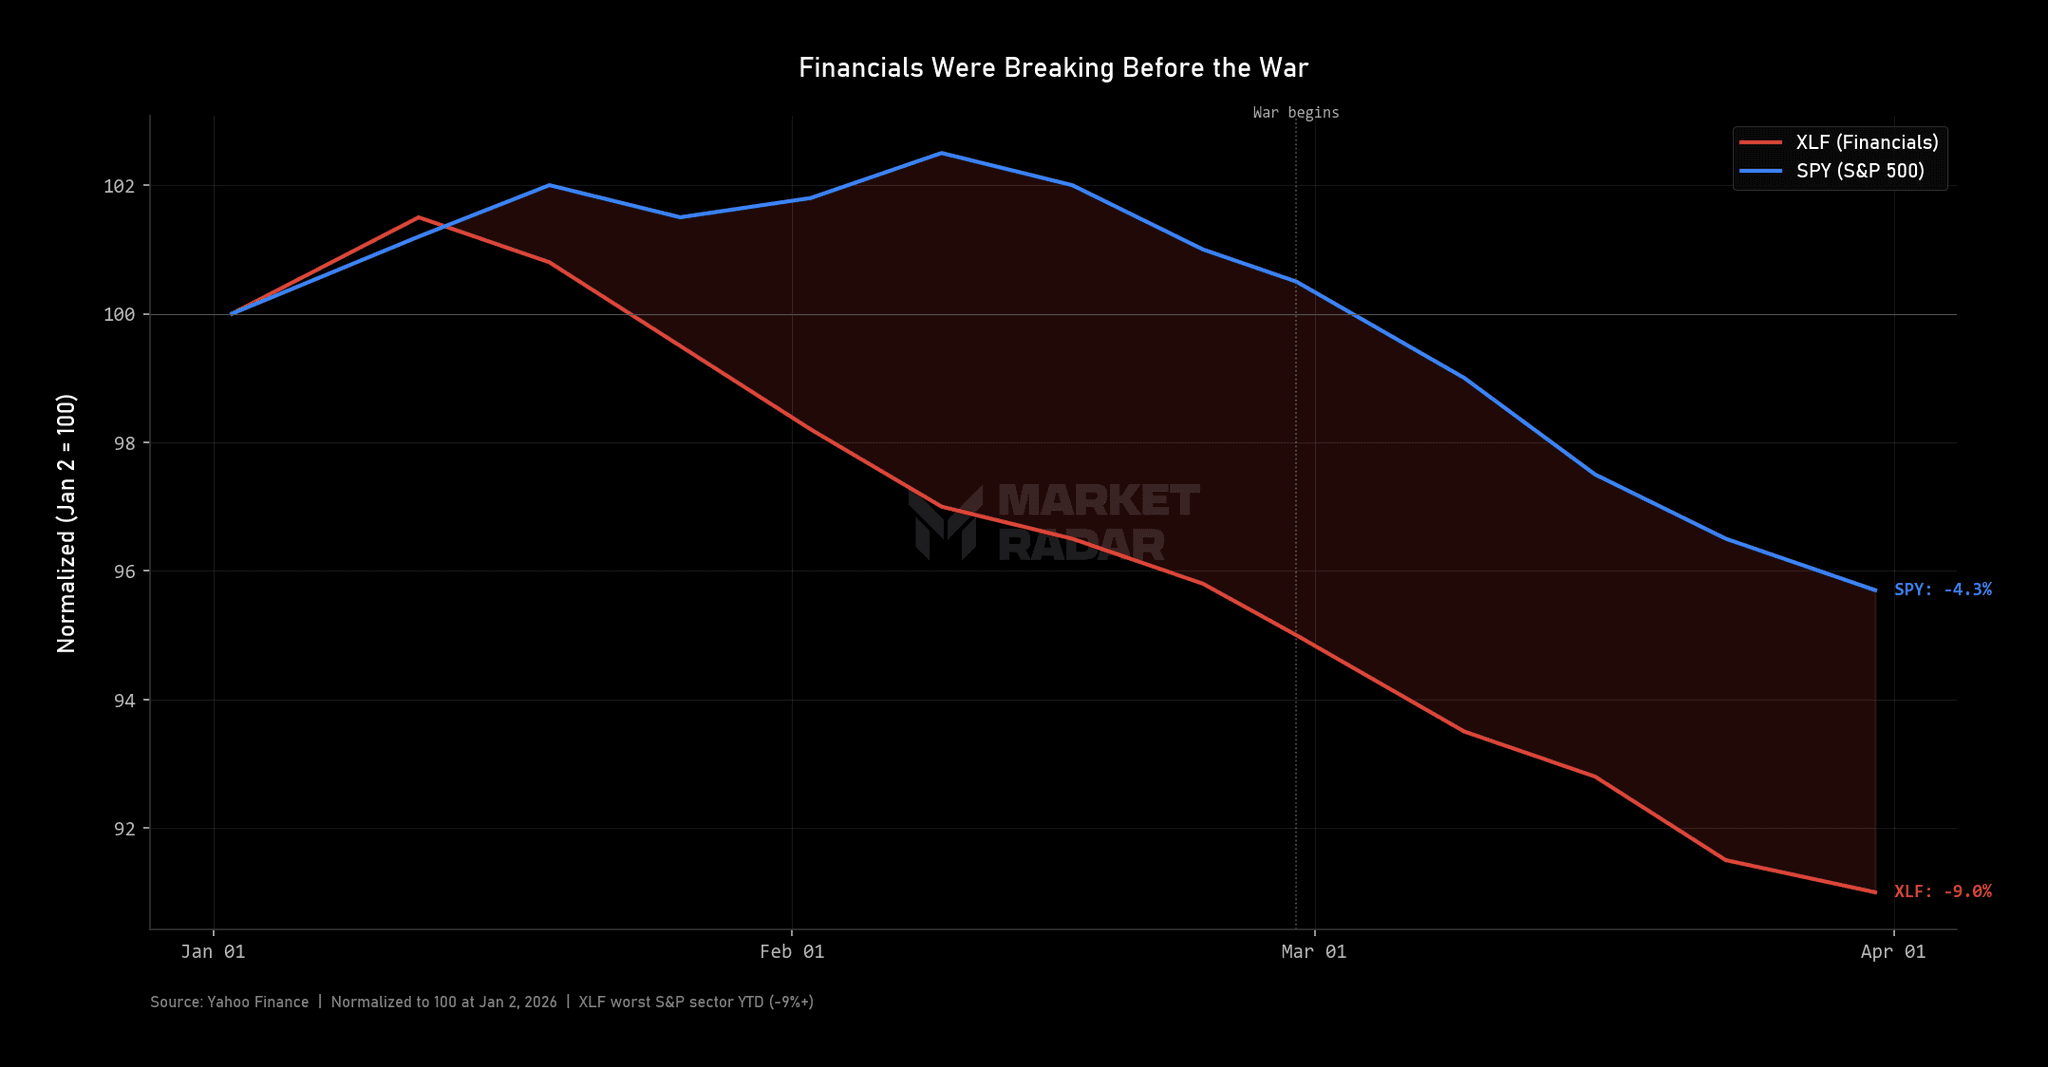
This next part has nothing to do with Iran. That is the point.
Financials are the worst-performing sector in the S&P 500 this year. Down more than 9%. And the weakness was building well before anyone had heard of Operation Epic Fury. XLF, the financial sector ETF, was rolling over in January and February while the rest of the market was still trading near all-time highs. The reason has nothing to do with Iran and everything to do with private credit. The private credit boom that defined the post-pandemic era, the one that attracted hundreds of billions from yield-hungry investors in a higher-rate world, is unwinding. High-profile collapses at firms like First Brands and Tricolor triggered a cascading wave of redemption requests across the industry. Apollo, Ares, and Blue Owl scrambled to restrict investor withdrawals. At Blackstone's BCRED fund, the largest private credit vehicle in the world, investors attempted to withdraw $3.8 billion in a single quarter, roughly 8% of total assets, which forced the firm to inject $400 million of its own capital and senior executive personal funds just to meet the redemption requests.
Regional banks are facing the same kind of pressure from a different direction. Commercial real estate exposure across the regional banking sector remains elevated, with total criticized assets, a measure of loans that are deteriorating in quality, trending above 2020 levels with no sign of reversing. The CRE refinancing wall that analysts have been warning about for the past two years is finally arriving, and it is arriving into an environment where rates are not coming down, where oil is pushing operating costs higher for every commercial property in the country, and where the Fed has signaled that it is not cutting anytime soon. These problems are already showing up in the stock prices of the most exposed banks.
The reason this matters for the stagflation thesis is that none of these problems are caused by the war. A ceasefire in Iran does not fix private credit deterioration. Lower oil prices do not reverse the CRE refinancing cycle. A diplomatic resolution does not recapitalize the funds that have already gated investor withdrawals. These are structural cracks in the domestic financial system that were building quietly throughout 2025 and into early 2026, underneath the surface of an economy that looked strong in aggregate, and they represent a second, entirely independent source of downward pressure on growth that will persist regardless of what happens in the Middle East.
Powell himself said something at the March 18 press conference that we think deserves far more attention than it received. After adjusting for what the Federal Reserve believes is systematic overcounting in the establishment survey payroll data, he noted that there has been "effectively zero net job creation in the private sector over the past six months." Not negative 92,000. Zero. Over six months. After adjustments. If that characterization is even roughly accurate, it means the labor market was not strong going into this oil shock. It was flat. It was producing no net new private sector jobs even before $100+ oil, a private credit crunch, and a frozen Fed entered the picture. Under the weight of all three of those forces simultaneously, it does not stay flat for very long.
The Fed Is Trapped, and the Market Knows It
The bond market figured this out before the Fed did. Pricing now shows a 51% probability of a hike by March 2027. No cuts until December 2027. Before the war, markets were expecting more than two cuts this year. That is a complete 180 on the disinflation story that had been the consensus for two years.
The Fed is on the sidelines now. If they hold rates steady to fight inflation, they are effectively tightening into a supply shock and risking the acceleration of the growth deterioration they want to prevent. If they cut rates to support growth, they risk further unanchoring inflation expectations that have inflation running sustainably above their 2% target. Right now, they're choosing to hold and hope the oil shock resolves itself before the damage to growth becomes irreversible. The major market indices have sold off over the last few weeks, with more than 2 rate cuts being removed from the market. How these cuts come back into the market will be important. If cuts do return, and growth impulses are not bullish at that time, it's a deflation signal, and that's even worse for markets.
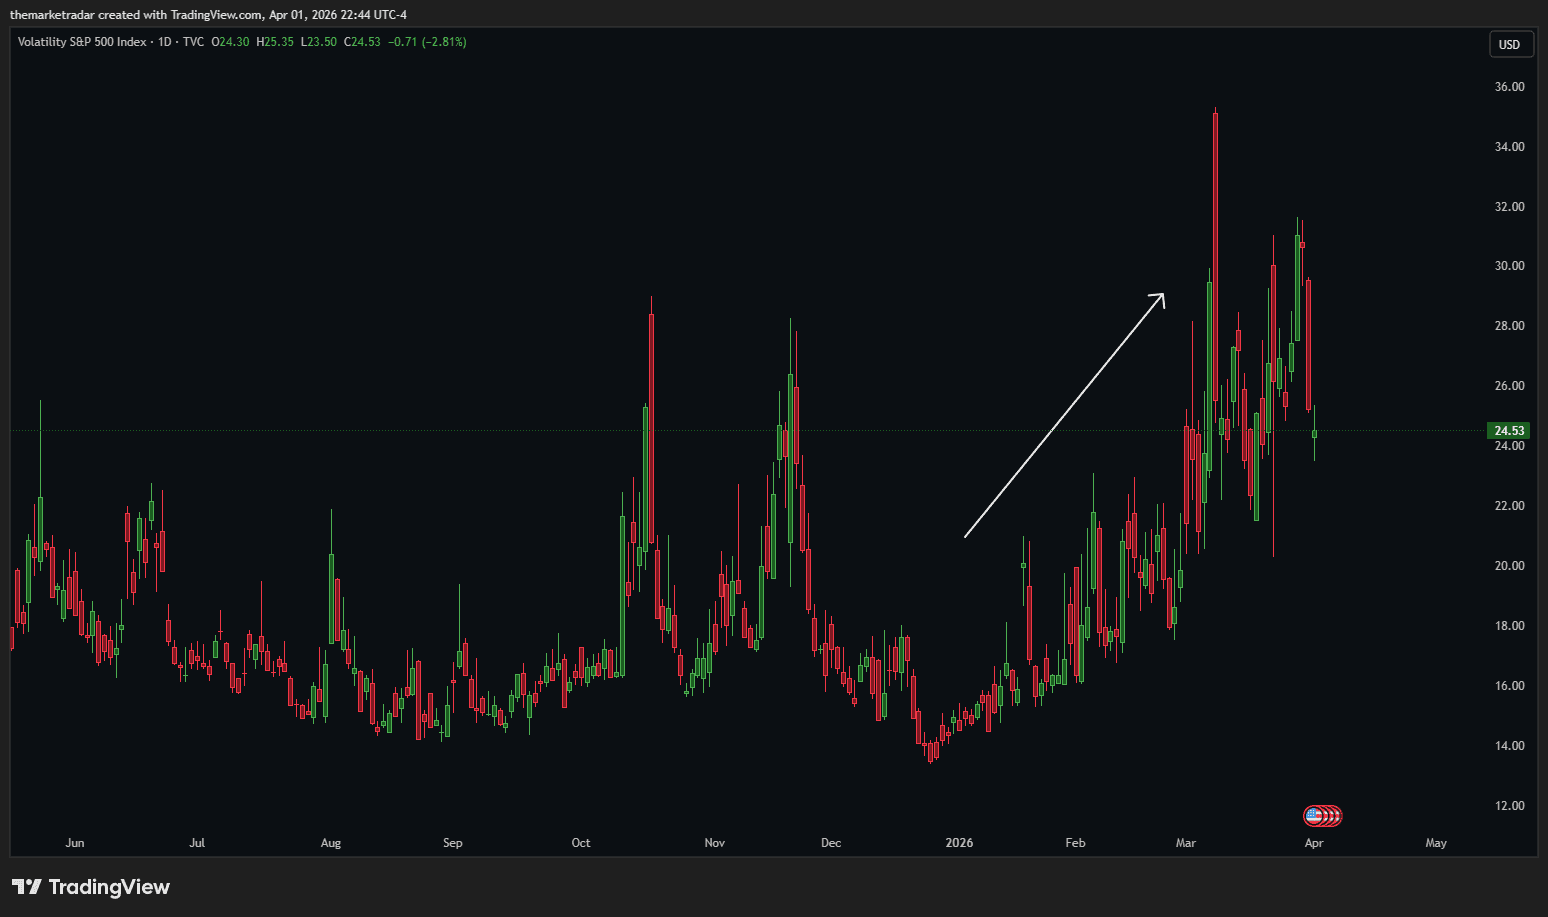
And the market environment is making everything worse. Volatility has been persistently elevated since the war started. Every rally attempt has been sold. The VIX at this point is not measuring one risk. It is measuring accumulated fragility, the system's shrinking ability to absorb the next bad headline without something breaking. Every negative surprise lands harder in this environment. Every positive surprise has to work twice as hard to stick. Nothing about this backdrop is neutral.
What We Are Watching
Three things will determine which side of the stagflation threshold we land on over the next two months.
The first is this week's Non-Farm Payrolls. The consensus estimate is +55,000. If the number confirms the -92K trend with another deeply negative or negligible print, the growth index will face genuine sustained pressure for the first time. Growth has been flat for three months while inflation has surged past it. A second consecutive major miss would begin pulling the growth index lower, widening the divergence between the two indices and moving the economy materially closer to a regime transition. If the number comes in positive and even modestly beats expectations, it buys time and extends the window in which the growth impulse can absorb the shock without rolling over.
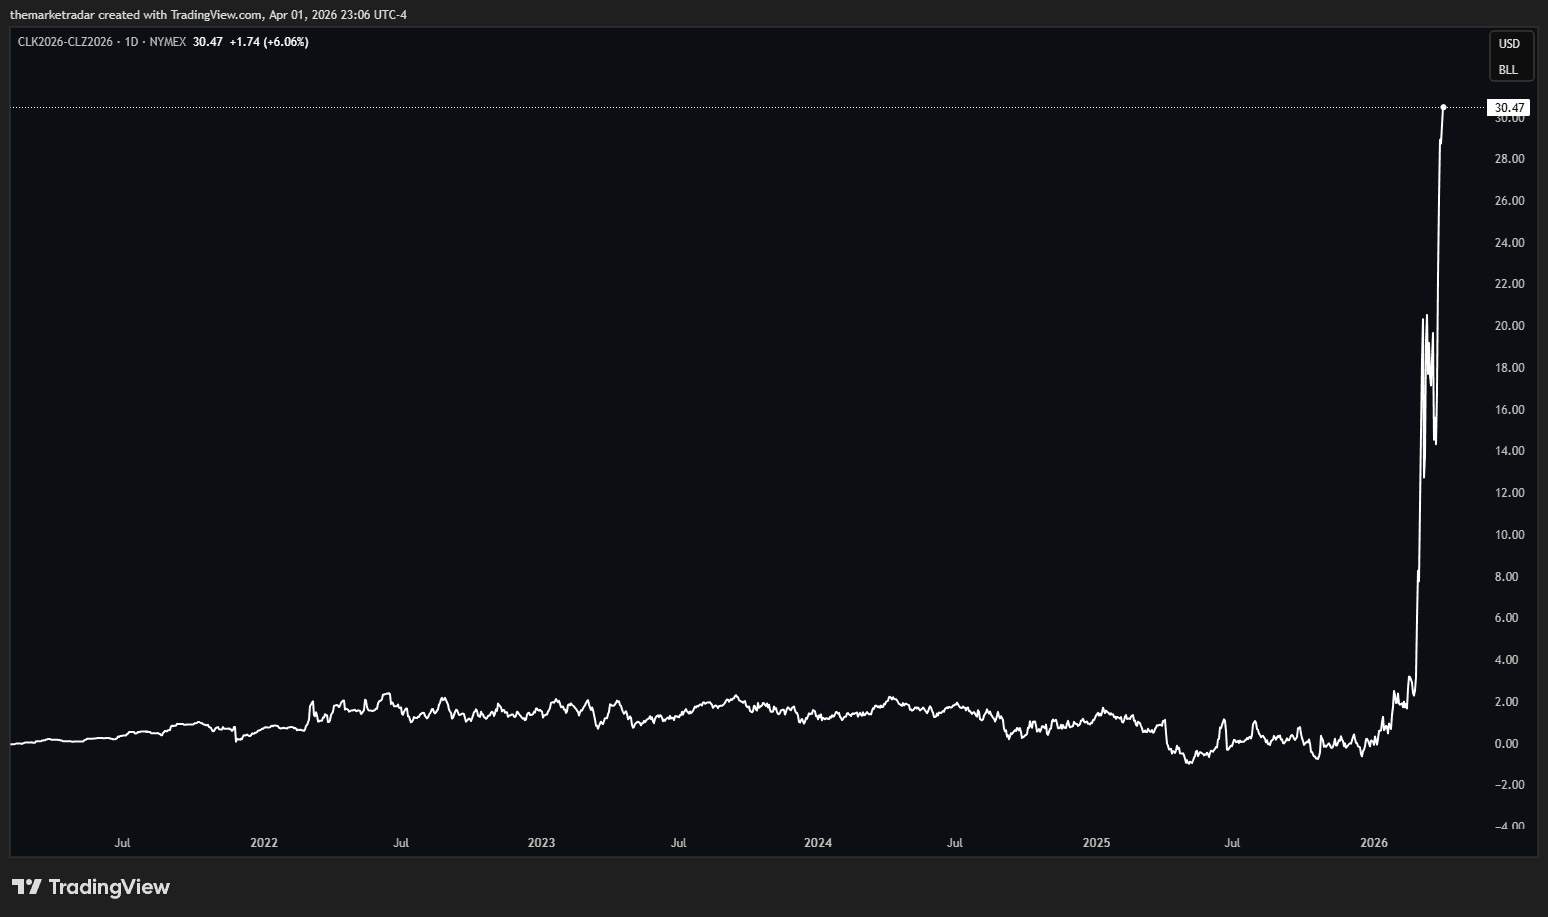
The second is the trajectory of the conflict and the oil price. The diplomatic picture is genuinely messy and riddled with deliberate disinformation from both sides. China and Pakistan have presented a formal peace initiative. Khamenei is reportedly open to talks. Iran's foreign ministry simultaneously denied requesting a ceasefire, which may be negotiating posture or may be genuine. Ship passage agreements with China, Russia, India, and Pakistan are cracking the blockade at the margins, but peace talks stalled over the weekend and oil futures opened higher on the news. The oil futures curve tells you what the market actually believes beneath the headline noise: the spread between front-month WTI and December WTI is roughly $30 per barrel, an extreme premium that reflects an acute near-term supply crunch the market expects to gradually ease toward year end. The long end of the curve is saying this is a shock, not a permanent repricing, backed by record US production and non-OPEC capacity. That is the optimistic read. The less optimistic read is that even the resolution scenario leaves December WTI around $74, still significantly above pre-war levels, and that Rapidan Energy warns LNG exports will not resume until there is "full certainty the strait is safe," a process that takes weeks even after fighting stops. The physical damage to refineries and LNG trains does not heal with a diplomatic handshake.
The third, and the one we care about most, is the relationship between our growth index and our inflation index. The inflation index at 100.145 is currently running above the growth index at 100.117, and that divergence has widened every week since the war began. As long as both indices stay in positive territory, the regime holds Inflation and remains Risk-On. If the growth index begins to roll lower while the inflation index holds steady or continues rising, the regime transitions toward Stagflation. We do not need to predict the outcome of payrolls, peace negotiations, or FOMC meetings to manage risk. We watch the indices. The system tells us what they mean.
Our Outlook
We are going to be direct.
Stagflationary regime probabilities are elevated and rising. If current conditions persist, if oil stays above $100, if the inflation index continues to outpace the growth index, and if the forward-looking data keeps deteriorating while the backward prints gradually catch up to the shock, we expect the regime to transition toward Stagflation within the next 30 to 45 days. Every sustained energy shock in modern history, 1973, 1979, 1990, 2008, 2021, eventually fed through to growth. This shock is barely a month old, the structural supply damage is worse than any of those historical precedents, and the central bank has no playbook for a supply-side crisis at this scale.
The one thing that changes our view is growth retaking the lead. If the growth index overtakes the inflation index to the upside, if the American economy proves strong enough to absorb $100+ oil and $4 gas and a private credit crunch and a frozen Fed without flinching, then the Inflation regime holds and the bull case we published a month ago comes back off life support. That would require not just data that beats lowered expectations, but a genuine acceleration in economic activity that outpaces the inflation drag. We are not seeing that. Growth is flat. Inflation is surging. And the forces that have been propping up the growth reading, the AI capex flywheel, the backward-looking data beats, the anchored claims numbers, are all facing their first real stress test simultaneously.
We are not calling for a crash. This is not a prediction. It is a probability statement. A month ago, Stagflation was a tail risk we mentioned in a single paragraph. Today it is a plausible base case on a 30-to-45-day horizon if nothing changes. Friday's payroll number, the next round of inflation prints, and whatever happens with Iran will either confirm that or challenge it. We will update when the data does.
RQF has been in cash since March 9. We published the bull case fully in TQQQ, the trend broke the next morning, the system sold. The regime said go. Price said stop. We followed the rules.
The regime model is still Risk-On, and that matters, because it means the re-entry trigger is live. The moment equity trends confirm, we are back in. If Iran resolves, oil pulls back, and the growth index overtakes inflation again, we re-enter with full conviction into a market that has been washed out and repriced lower. That is the scenario we would love to write about next month.
But if the shock persists and growth rolls over, we stay in cash. Capital intact. Waiting. While the market absorbs whatever comes next from a supply-driven inflation crisis that nobody's central bank has the tools to fix.
We are watching. The system will tell us when to move.
As a side note, we are nearly done with an updated Ares strategy that aims to drastically reduce volatility and take better advantage of risk-off regimes like stagflation and deflation. This update will be coming shortly to all members and will be a key part in taking advantage of the likely incoming stagflation and deflation regimes.
MOST POPULAR
Unlock Premium Content
The remainder of this content is available to Radar members only. Subscribe to gain instant access.
$65/month
Billed annually at $780 (Save $120)
Access Models which boast 40%+ average yearly returns
Automated Portfolio Signals (RQF Strategy)
Live Calls with experienced traders
QuantBase Dashboard with macro regime models
DDAP TradingView Indicator
Real-time portfolio updates
Private Discord Channels
Lifetime Price Lock|Instant Access