5 MIN READ·SEPTEMBER 3, 2025
Seasonality Trends: Valuable or Useless?
MR
CO-FOUNDER · MARKET RADAR

Every September, financial media dust off the same charts: “The worst month for stocks,” “Sell in May and go away,” “Santa Claus rally.” Seasonality lore is as old as the market itself, and it never fails to draw eyeballs. What if I told you seasonality was nonsense? Would you believe me? Well, you should, and here’s why.
Seasonality feels intuitive because humans crave patterns. Averages get packaged into tidy charts, turning decades of data into simple narratives: on average, the market is weak in September, strong in December. That simplicity is seductive. It gives traders and investors the feeling they’ve uncovered a hidden rhythm to the market. Investors love this idea of a pre-determined path; truly, it's the idea of stability that sells so well. The only problem is, when you actually look at how seasonality has played out in the past, it makes no sense why you would position yourself so significantly around these so-called "weak" and "strong" months.
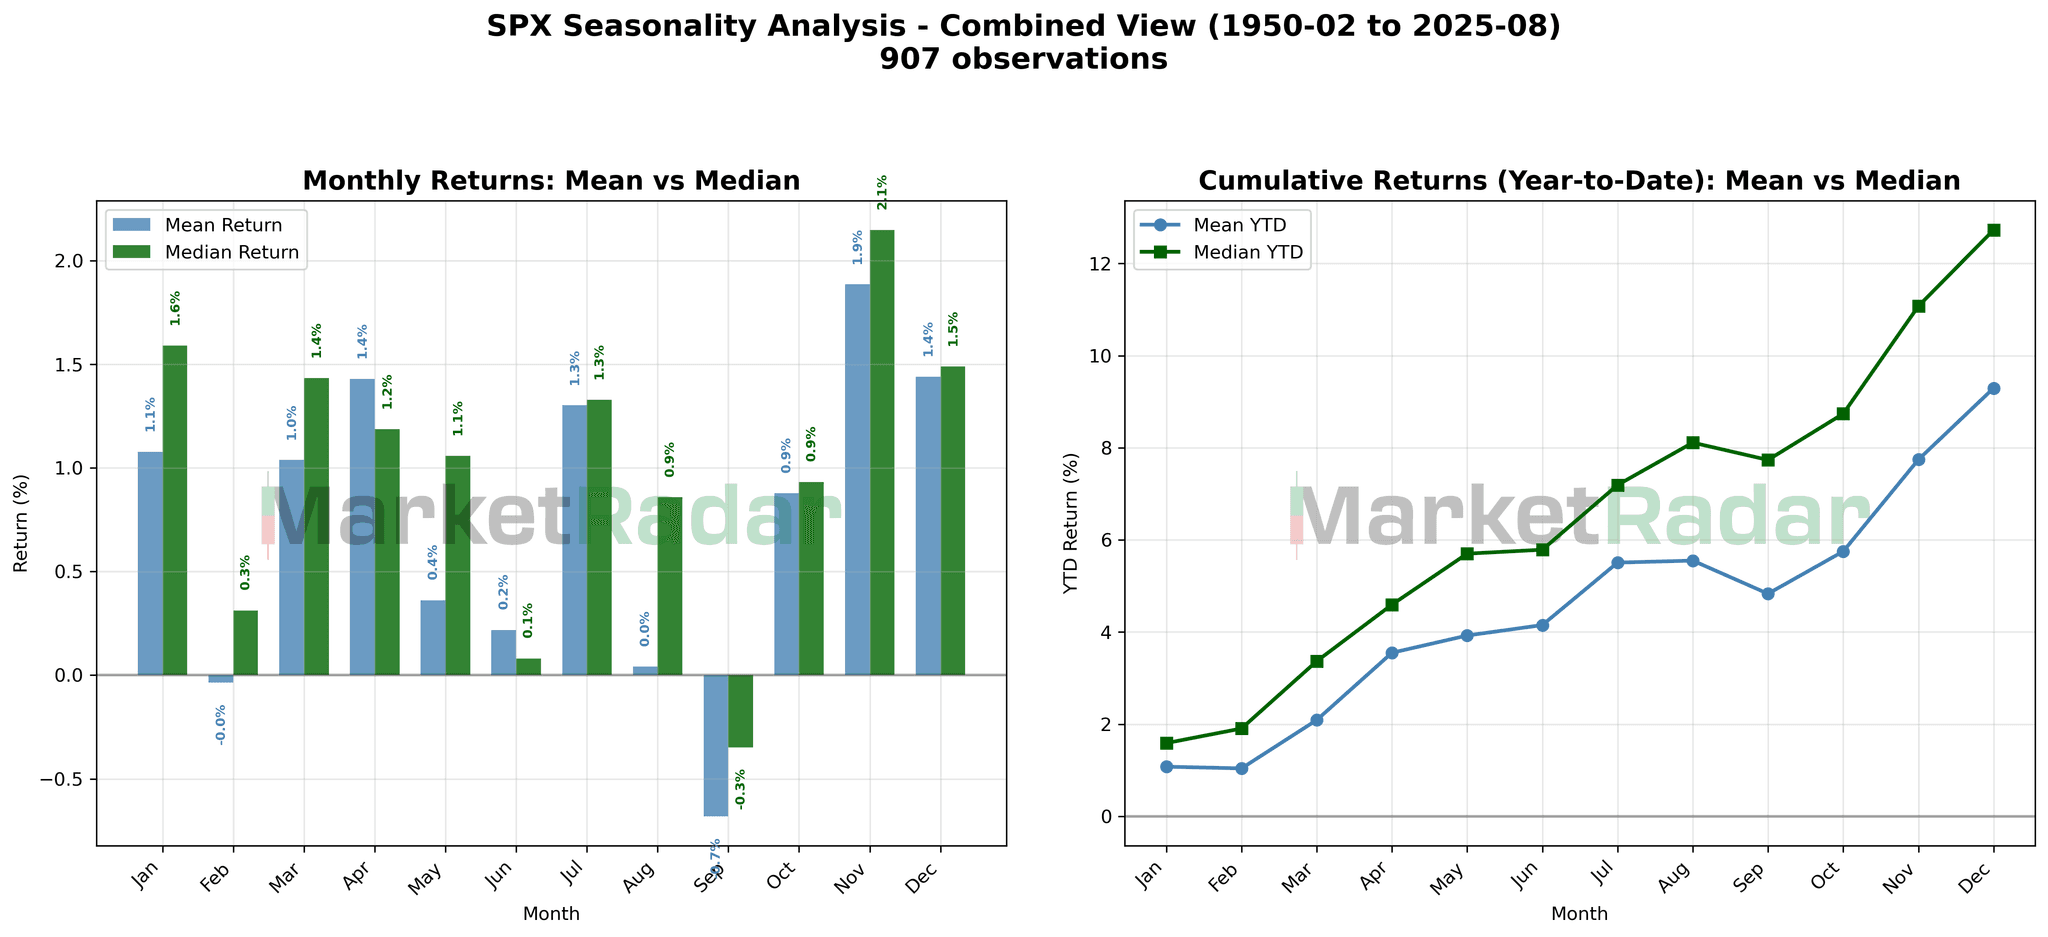
Let’s first start with how seasonality is typically measured. You’ve probably seen charts floating around the internet that show the average return for each month, stacked into a tidy line of mean returns across the year. That’s the mean, or simply the sum of all returns for a given month divided by the number of years.
What you probably don’t see as often is the median return. The median represents the middle value when all those monthly returns are lined up from worst to best. Unlike the mean, it isn’t pulled around by extreme outliers, and one monster rally or crash won’t distort it. This makes the median a better lens for seeing the typical experience of the market in a given month, rather than the mathematically average one.
This chart overlays both the mean and median seasonal returns for the S&P 500 since 1950. At first glance, you can see how switching from mean to median reshapes the picture. What looks like a dip in early February on an average basis turns into a solid gain when viewed by median. The famous “sell in May and go away” pattern doesn’t hold up; August looks far stronger than the lore suggests, and September comes out only about half as bad. Things get even more interesting...
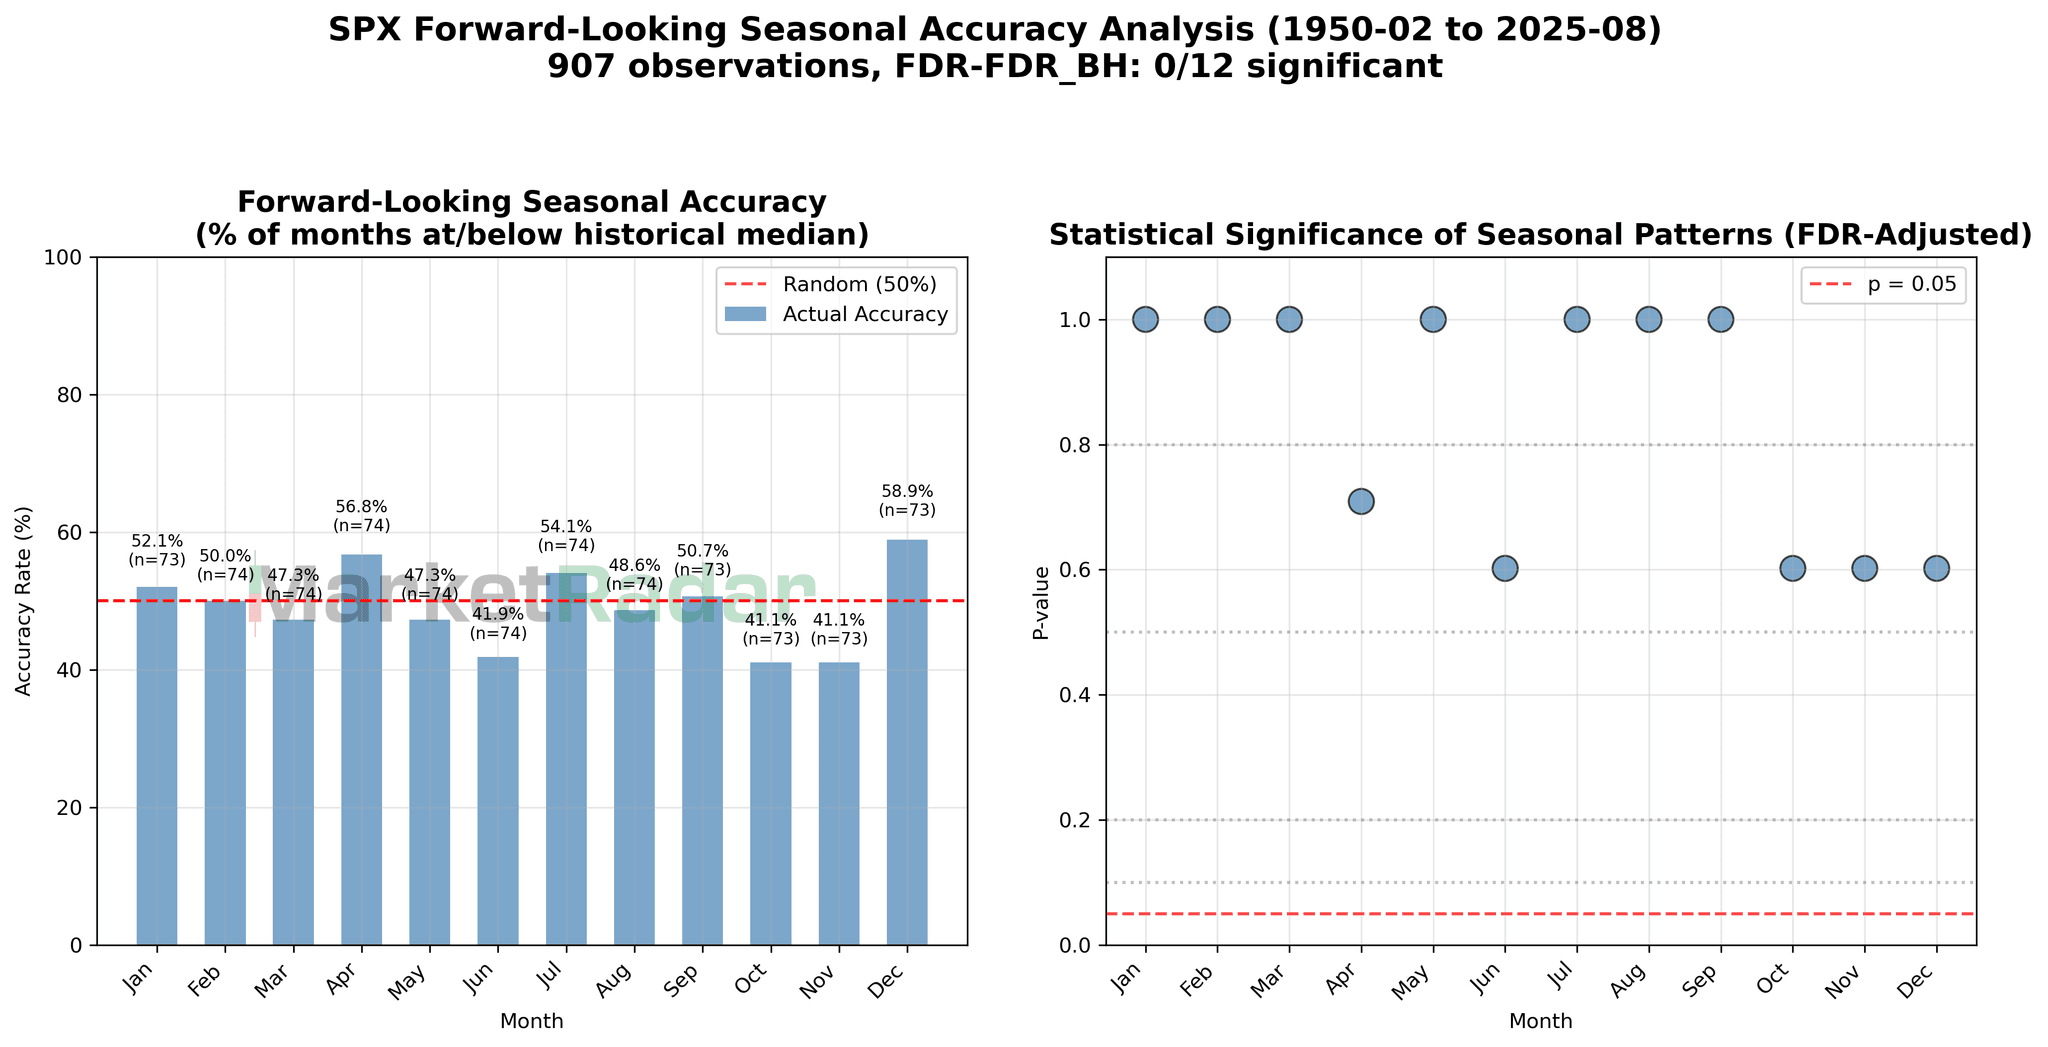
The chart on the left (Forward-Looking Seasonal Accuracy) tests how “accurate” seasonality really is. It looks at each month of the year and asks: if I expected this month to perform at or above its historical median return, how often would that actually happen?
If seasonality really worked, you’d expect win rates well above 50%. But what we see instead is that most months land right around a coin flip. Some months are a touch higher (like December at ~59%), while others are worse (like November at ~41%), but overall it’s no better than random guessing.
The chart on the right (Statistical Significance) checks whether those seasonal patterns are statistically significant. The red line marks the conventional cutoff (p = 0.05). Anything above that line means the pattern could easily be explained by randomness. As you can see, every single month sits above the threshold. In other words, none of the seasonal effects are strong enough to confidently separate from noise.
The big picture: While historical averages and medians can make for compelling charts, they don’t provide reliable support for timing the same months going forward. Seasonality is more market folklore than a forecasting tool.
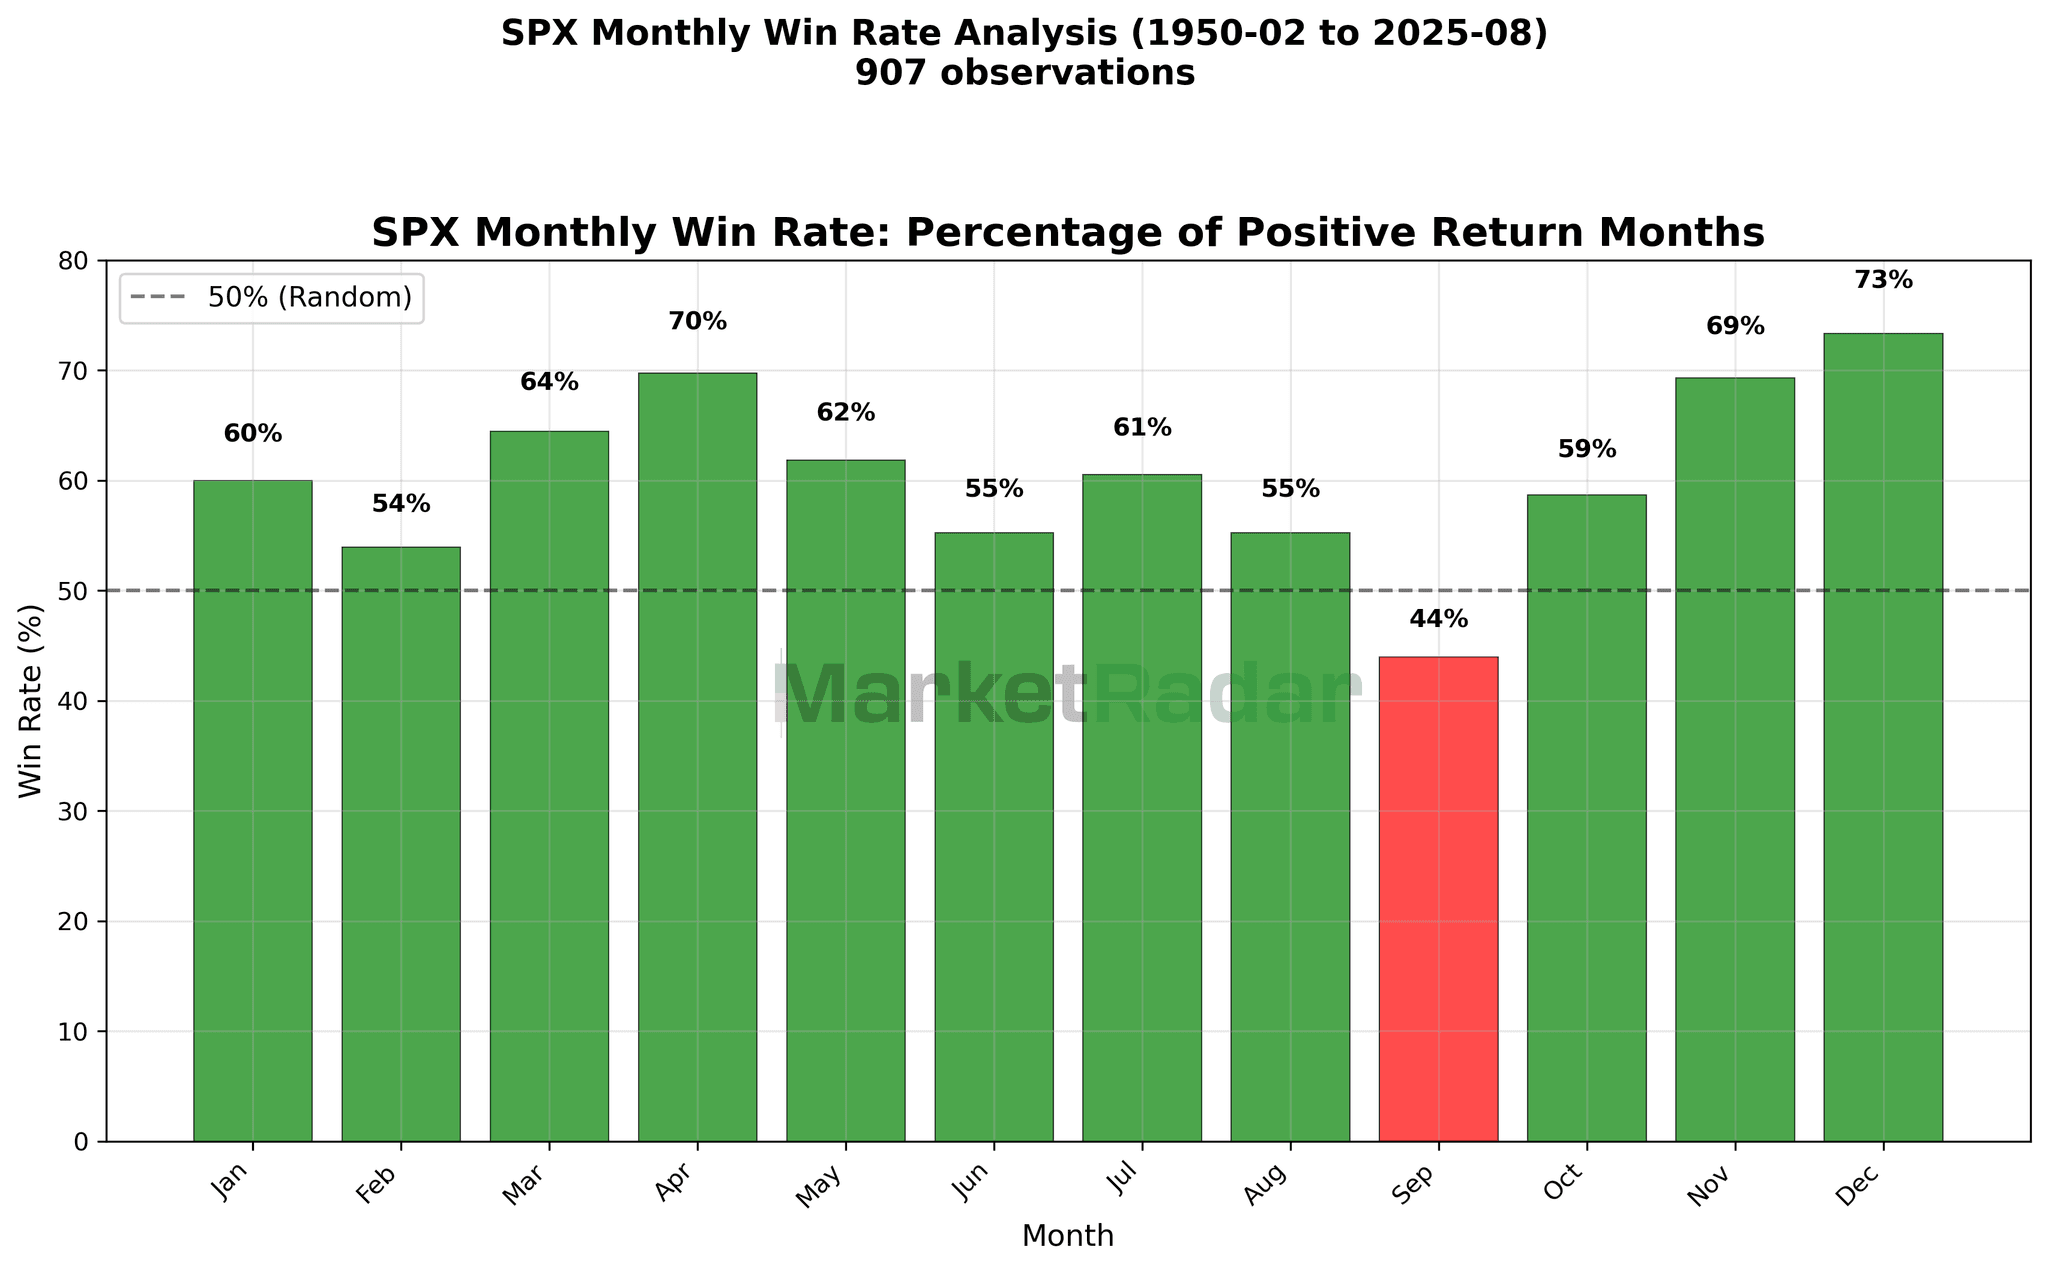
This chart below runs the most straightforward test of seasonality: if you’re long the S&P going into a given month, what are the odds you’ll finish that month with a gain? The green bars show the percentage of positive months since 1950. For example, December has been positive about 73% of the time, while September has been positive only 44% of the time.
If you flipped the logic and went short instead, your odds would be roughly the inverse of these numbers (though unchanged or flat months muddy the math slightly and aren’t consistent enough to matter).
🚀 Join the Radar Community
Get free access to MacroBase and notifications about new posts and updates.
In other words, this chart is just the raw win rate of each month. It shows the market’s historical “personality” — some months tilt positive more often than others, but those tendencies don’t translate into reliable forecasts going forward. As we noted earlier, actually hitting or exceeding the median return for a given month is far less consistent than simply finishing green.
It’s tempting to assume the market “should” rise more easily from October through December than from July through August, but the data make it clear: the odds overwhelmingly favor just one thing. More on that next.
So what does seasonality actually represent? At its core, it’s just the illusion of an up-trending market. Those smooth seasonality charts that never dip red during the year don’t capture anything magical; they simply reflect the fact that stocks go up more often than they go down. Using seasonal averages to time entries and exits is really just an attempt to forecast the path of an already statistically proven long-term uptrend.
The issue comes when you try to act tactically. Take September as an example: there’s about a 56% chance it’s negative, and roughly a 51% probability that it underperforms its own median return of –0.3%. In the context of a year where the median return is over 12%, that single month’s drag only represents about 2.5% of annual gains. But what the seasonality chart doesn’t show you is the distribution of outcomes, the real story of how volatile those months can be, and what tends to come next.
That’s where the candlestick view comes in.
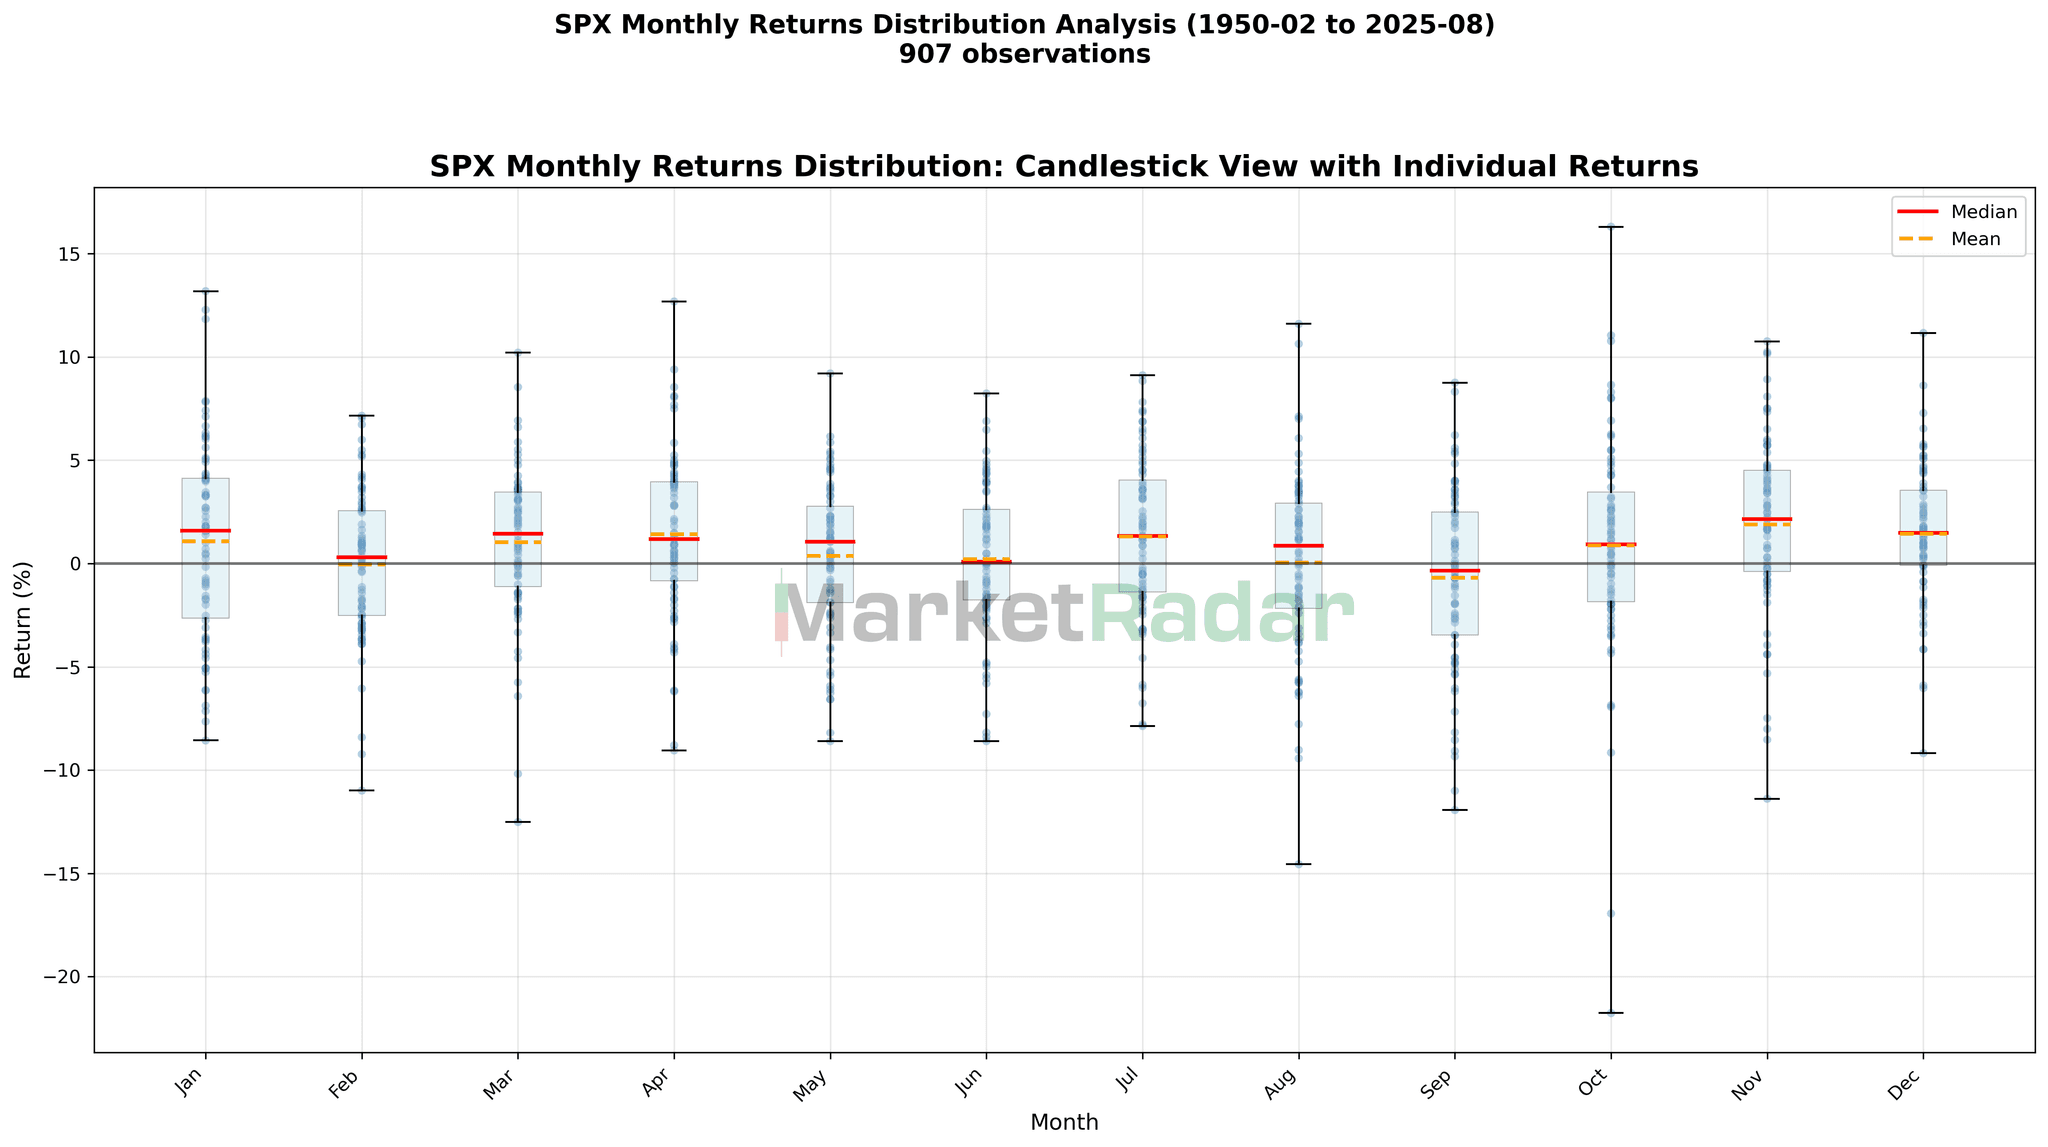
Looking at the candlestick distribution, September does stand out. It has the lowest win rate at 44% and a median return of –0.3%, which makes it look like dead weight. But that headline number hides the real story. The month has delivered plenty of years with +2%, +5%, even double-digit gains—outcomes you’d never see if you only looked at a seasonality chart.
By stepping aside to avoid the “average” loss, you’re also giving up the chance to capture a meaningful piece of the market’s yearly return. And because compounding over time is what drives equity gains, the opportunity cost of skipping out often ends up bigger than the seasonal drag itself.
Now, holding cash is perfectly reasonable when markets are in a clear downtrend. Defense matters in bear markets. But stepping out just because “September is weak” misses the point. Markets drift higher over time unless economic conditions are truly bearish.
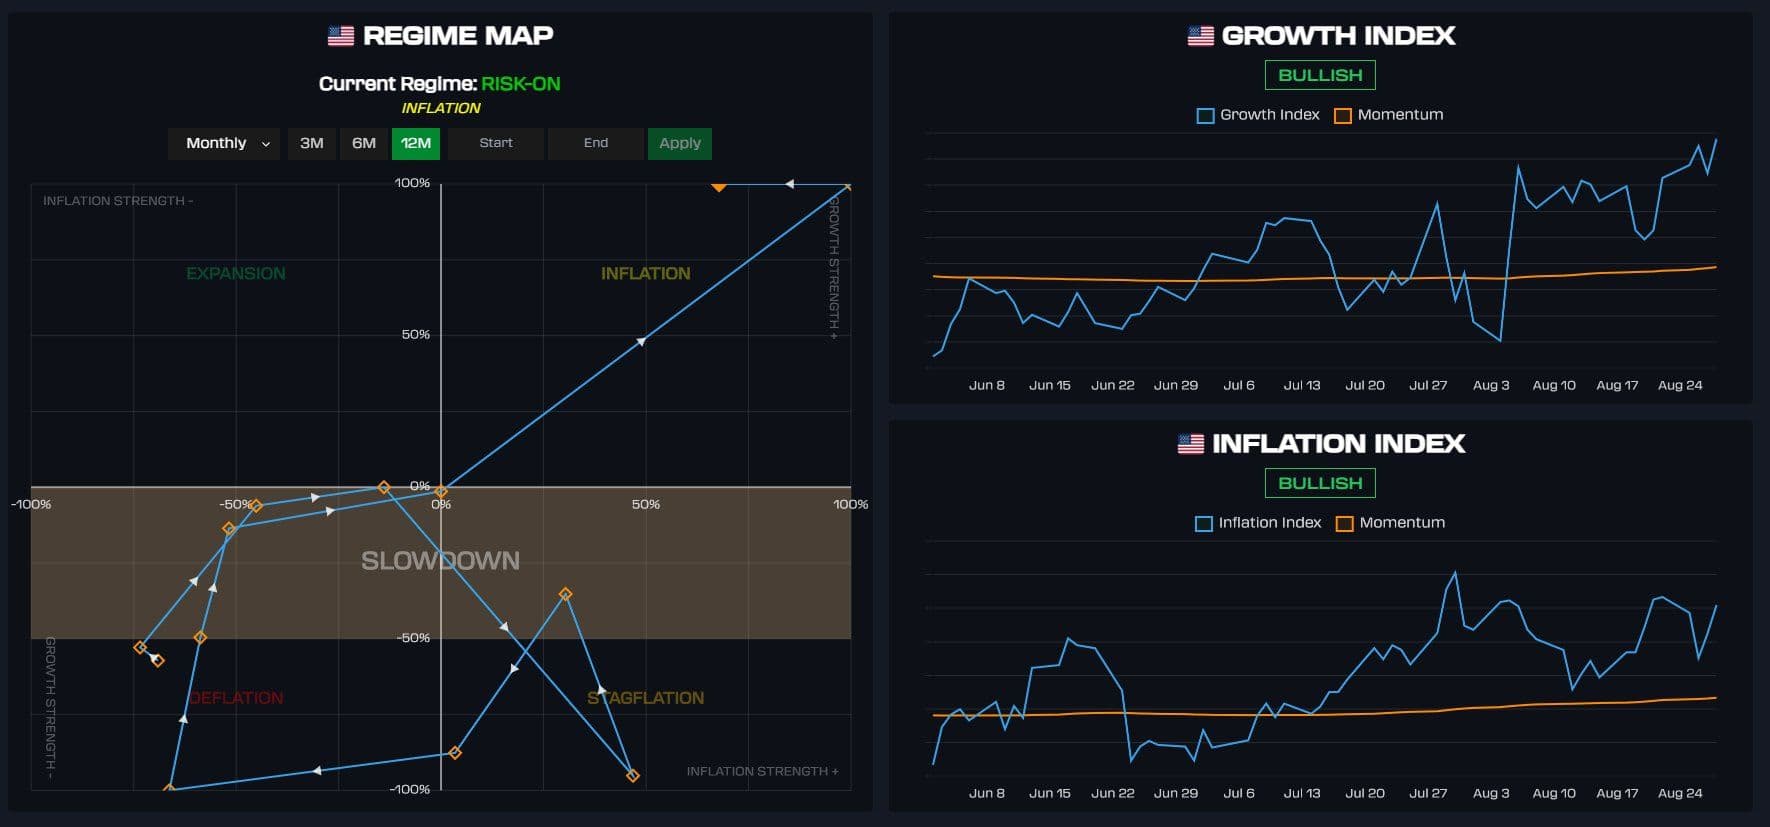
That’s the difference between acting on a rhyme in the calendar versus acting on data. Growth and inflation impulses move markets, not the page of the calendar. That’s why our process doesn’t guess which month “should” be strong or weak; we track real-time macro signals that show where the economy is heading before markets price it in. That’s how you capture upside in risk-on regimes and protect capital when risk-off sets in.
Seasonality is just a story. Macro is the signal. That’s where the real edge comes from. If you want to see the same models we track every day updated in real time, you can get full access below!
MOST POPULAR
Unlock Premium Content
The remainder of this content is available to Radar members only. Subscribe to gain instant access.
$65/month
Billed annually at $780 (Save $120)
Access Models which boast 40%+ average yearly returns
Automated Portfolio Signals (RQF Strategy)
Live Calls with experienced traders
QuantBase Dashboard with macro regime models
DDAP TradingView Indicator
Real-time portfolio updates
Private Discord Channels
Lifetime Price Lock|Instant Access