8 MIN READ·APRIL 16, 2026
Ares V3: The Most Powerful Systematic Model We've Built
MR
CO-FOUNDER · MARKET RADAR
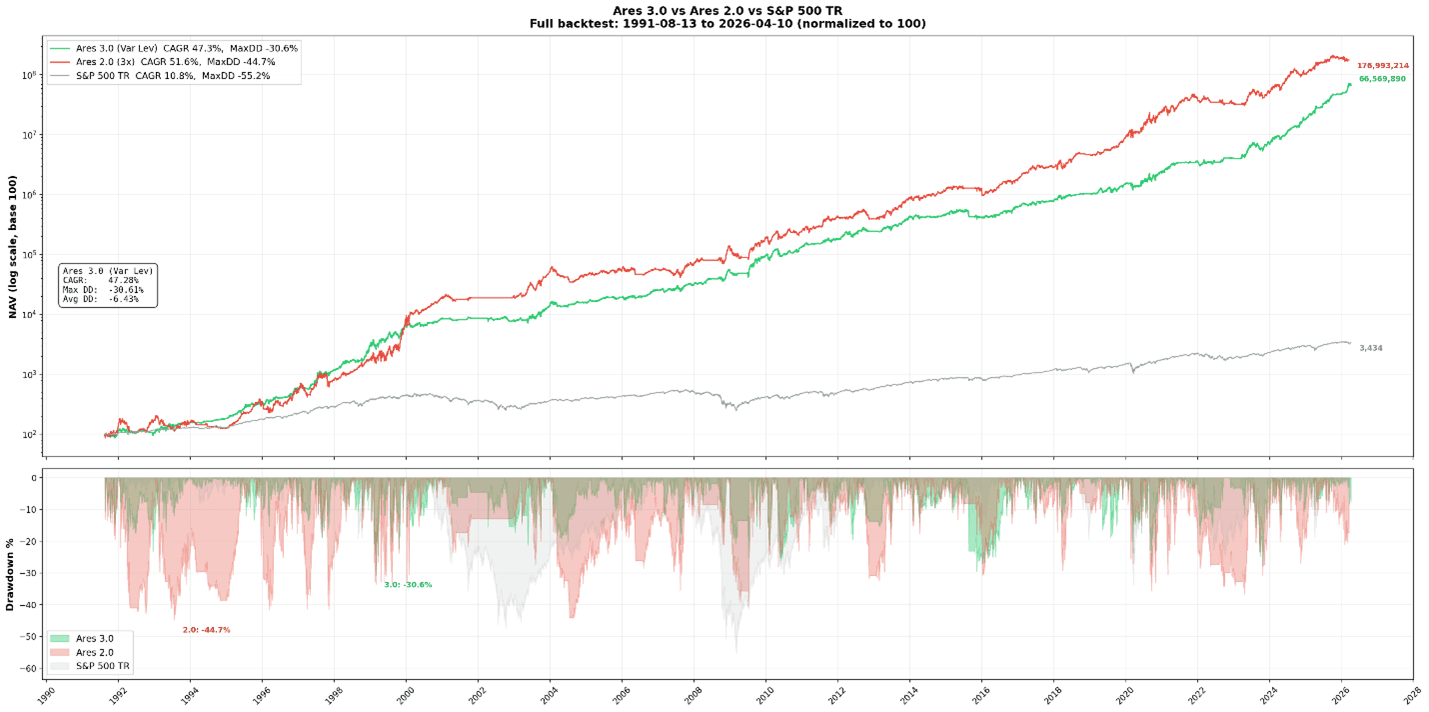
Our pre-existing model, Ares V2.0, compounds at 51% annually at a fixed 3x leverage rate. By any reasonable standard, that's an extraordinary model. But the main flaw was always the volatility it took to achieve those returns. Running Ares V2.0 with 2x leverage or unlevered was always an option, but that wouldn't yield the kind of returns we're looking for here at Market Radar. We want stupidly good returns. So over the last few months, we went back to the lab to try to figure out how to drastically lower portfolio volatility without compromising returns.
We've got something terrific here with Ares 3.0. We're going to run down as many details as possible and be as transparent as possible so you know what to expect with a model like this.
The criteria we use for our models are simple:
1. Must be easy to understand and execute
2. The rules must make logical sense
3. Compounded returns must be extraordinary, unlike anything available elsewhere
Leaning on the Regime System
Our Regime System is powerful. It picks up Risk-Off events better than anything we've ever seen. So we decided to lean on it more. Stagflation and Deflation environments are volatile, risky, and in most Stagflation cases, just flat-out inconsistent asset performance. So why are we still running 3x leverage in these uncertain environments?
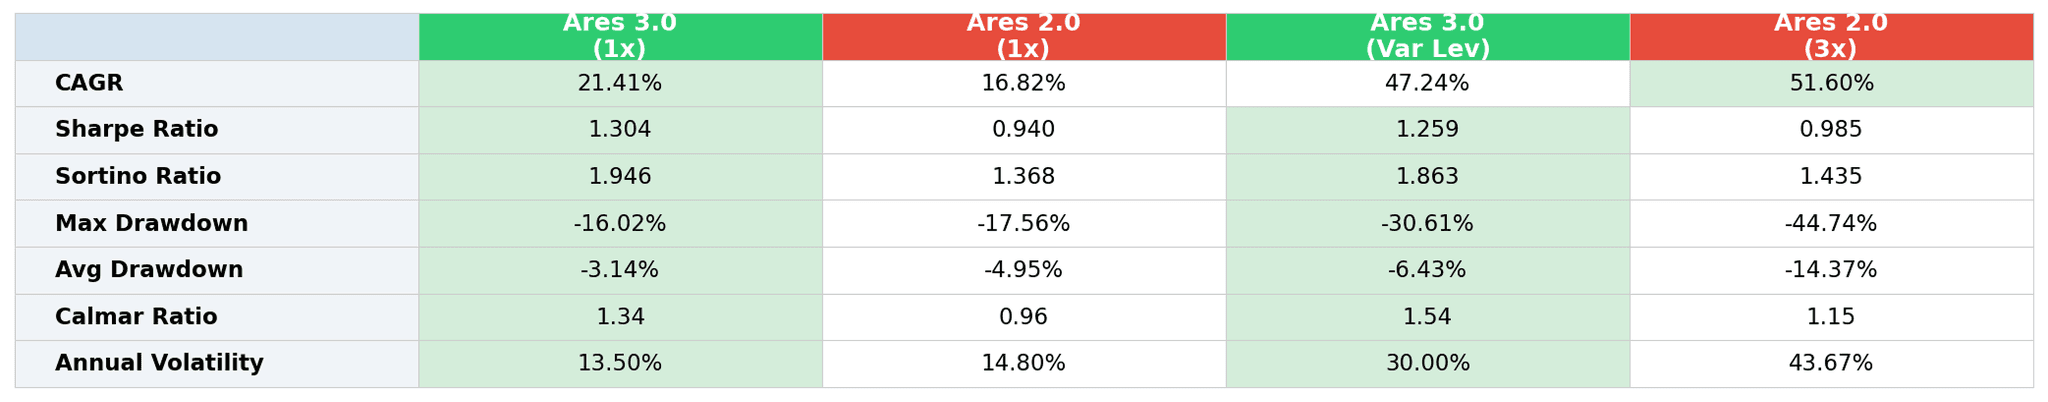
By simply deleveraging and slightly diversifying during Risk-Off regimes, we were able to significantly improve portfolio volatility and average drawdowns. Average drawdowns of Ares V3.0 are less than half of Ares V2.0.
Tighter Range, More Consistent Growth
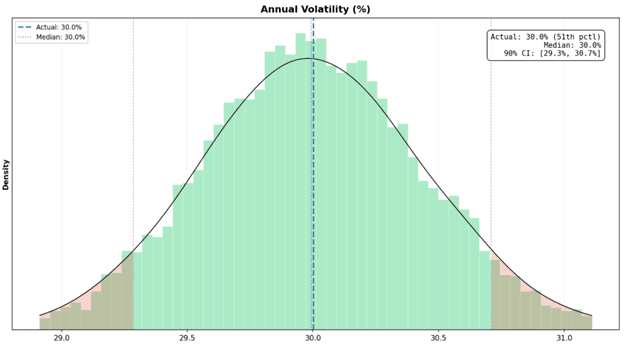
Annual volatility dropped significantly, from 43% to 30%. That tells us how much the strategy's daily returns scatter around their mean, expressed as a yearly percentage. In the new Ares, with a 47% CAGR and 30% annual vol, you'd expect roughly +/-30% swing in outcomes in a given year, fluctuating the CAGR between 32% and 61%. Ares V2.0 was fluctuating between 29% and 73%. That tighter range means more consistent growth with tighter drawdown control, something we think many of you were looking for.
The trade-offs for improving portfolio stability are either sacrificing returns, increasing turnover or both. We try to balance this fine line. We're not in the business of rebalancing a portfolio daily or trading numerous times per week. As per our rules, Ares must be easily executable. Naturally, since V3.0 is more diversified, that translates to roughly 43 trades per year on average compared to just 25 trades on Ares V2.0. Still low enough to manually manage, and well worth the trade-off in reduced volatility without much of a hit to the CAGR.
Monte Carlo Stress Test
We ran 10,000 bootstrap simulations on the Ares V3.0 strategy. The Monte Carlo methodology is straightforward: take the full daily return series, reshuffle it into random order 10,000 times, and compound each reshuffled path across the entire 34.6-year backtest window. This strips out every path dependency, every lucky sequence, every fortunate ordering of drawdowns and recoveries, and tells you what the strategy's statistical properties actually are when you remove the specific history we happened to live through.
What comes out the other side is a probability distribution, ten thousand possible outcomes from the same underlying return profile. And that distribution tells you whether the strategy has an edge that holds regardless of sequencing, or whether the backtest got lucky.
Ares did not get lucky.
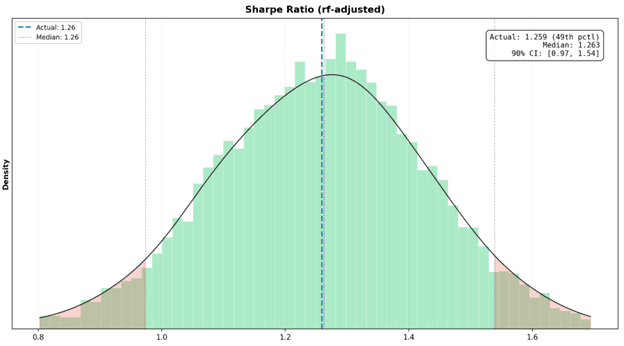
The median CAGR across all 10,000 simulations is 47.3% annualized. The realized backtest came in at 47.3%. That places the actual result at the 50th percentile of the distribution, which is as close to dead center as it is mathematically possible to get. The median Sharpe ratio across all simulations is 1.263. The realized Sharpe is 1.259, bringing in the 49th percentile. The returns we observed over 34.6 years are not the product of a favorable draw. They are exactly what you would expect from randomly reordering the same daily returns ten thousand different ways.
The 5th percentile path, the version of reality where sequencing goes against you at nearly every turn, still compounds at 35.3% annualized. The 95th percentile path sits at 59.9%. The probability of compounding above 30% annually across the full period is 99.1%. The probability of exceeding 40% is 83.7%, better than 4 in 5. These are what the existing return profile produces under every possible ordering we can simulate.
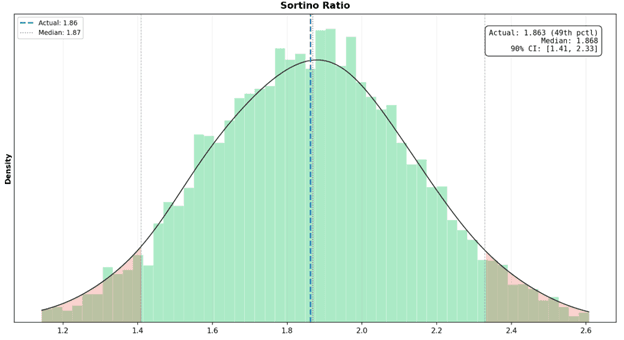
The Sharpe distribution is where the quality of the edge becomes most visible. In 93.4% of all simulated histories, Ares V3.0 delivers a Sharpe above 1.0. In roughly 6 out of 10, it exceeds 1.2. The Sortino ratio, which penalizes downside volatility specifically, centers at 1.87. These numbers are risk-free adjusted against the US 1Y Treasury yield, not inflated by ignoring the cost of leverage. A strategy that clears 1.0 on a risk-adjusted basis across 93% of all possible return sequences is a robust edge.
Now the risk side, because this matters just as much.
The median max drawdown across all simulations is -44.3%. That is worse than the -30.6% Ares V3.0 actually experienced. It means the specific sequence of returns we lived through avoided the worst possible clustering of consecutive losses, and we should not expect that to continue. There is a 73.8% probability that a reshuffled history produces a max drawdown exceeding -40%. There is a 23.8% probability it exceeds -50%. At the extreme tail, there is a 3.9% chance of a drawdown of -60%.
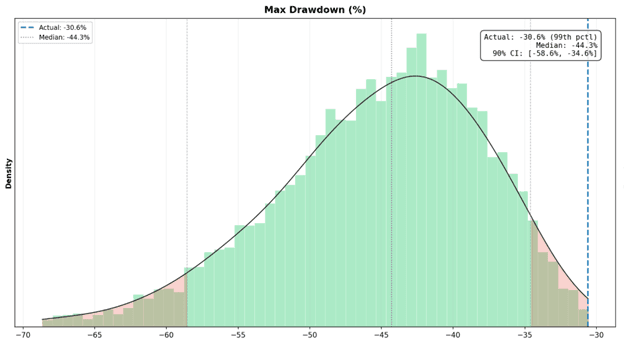
We're not presenting these numbers to scare anyone. We're presenting them because a leveraged strategy that compounds at nearly 47% annualized does not do so without drawdowns that test every assumption you have about your own risk tolerance. The median Calmar ratio, which divides annualized return by max drawdown, is 1.06. That means the strategy earns its entire worst-case loss back in a single year of average compounding. Whether that trade-off is acceptable depends entirely on your time horizon and your ability to hold through the kind of year that -37% represents. For us, running a systematic process that removes the temptation to intervene during those periods, the math works. For someone checking their portfolio daily and making discretionary decisions about whether to stay in, it might not.
🚀 Join the Radar Community
Get free access to MacroBase and notifications about new posts and updates.
The volatility distribution is tight and stable. The median annualized vol is 30.0%, and the 5th-to-95th range spans just 29.3% to 30.7%. The strategy does not have a vol regime problem. It runs at a consistent risk level regardless of how the returns are ordered, which means position sizing and risk management can be built around a number that does not move.
What the Monte Carlo ultimately tells us is the edge is in the daily returns, not in the path. The realized backtest is not an outlier. It is not the beneficiary of favorable sequencing. It sits at the dead center of what 10,000 reshuffled histories produce. The risk is real, the drawdowns under simulation are worse than what we have experienced, and we expect that gap to close over time. But the compounding rate on the other side of those drawdowns has held up under this stress test.
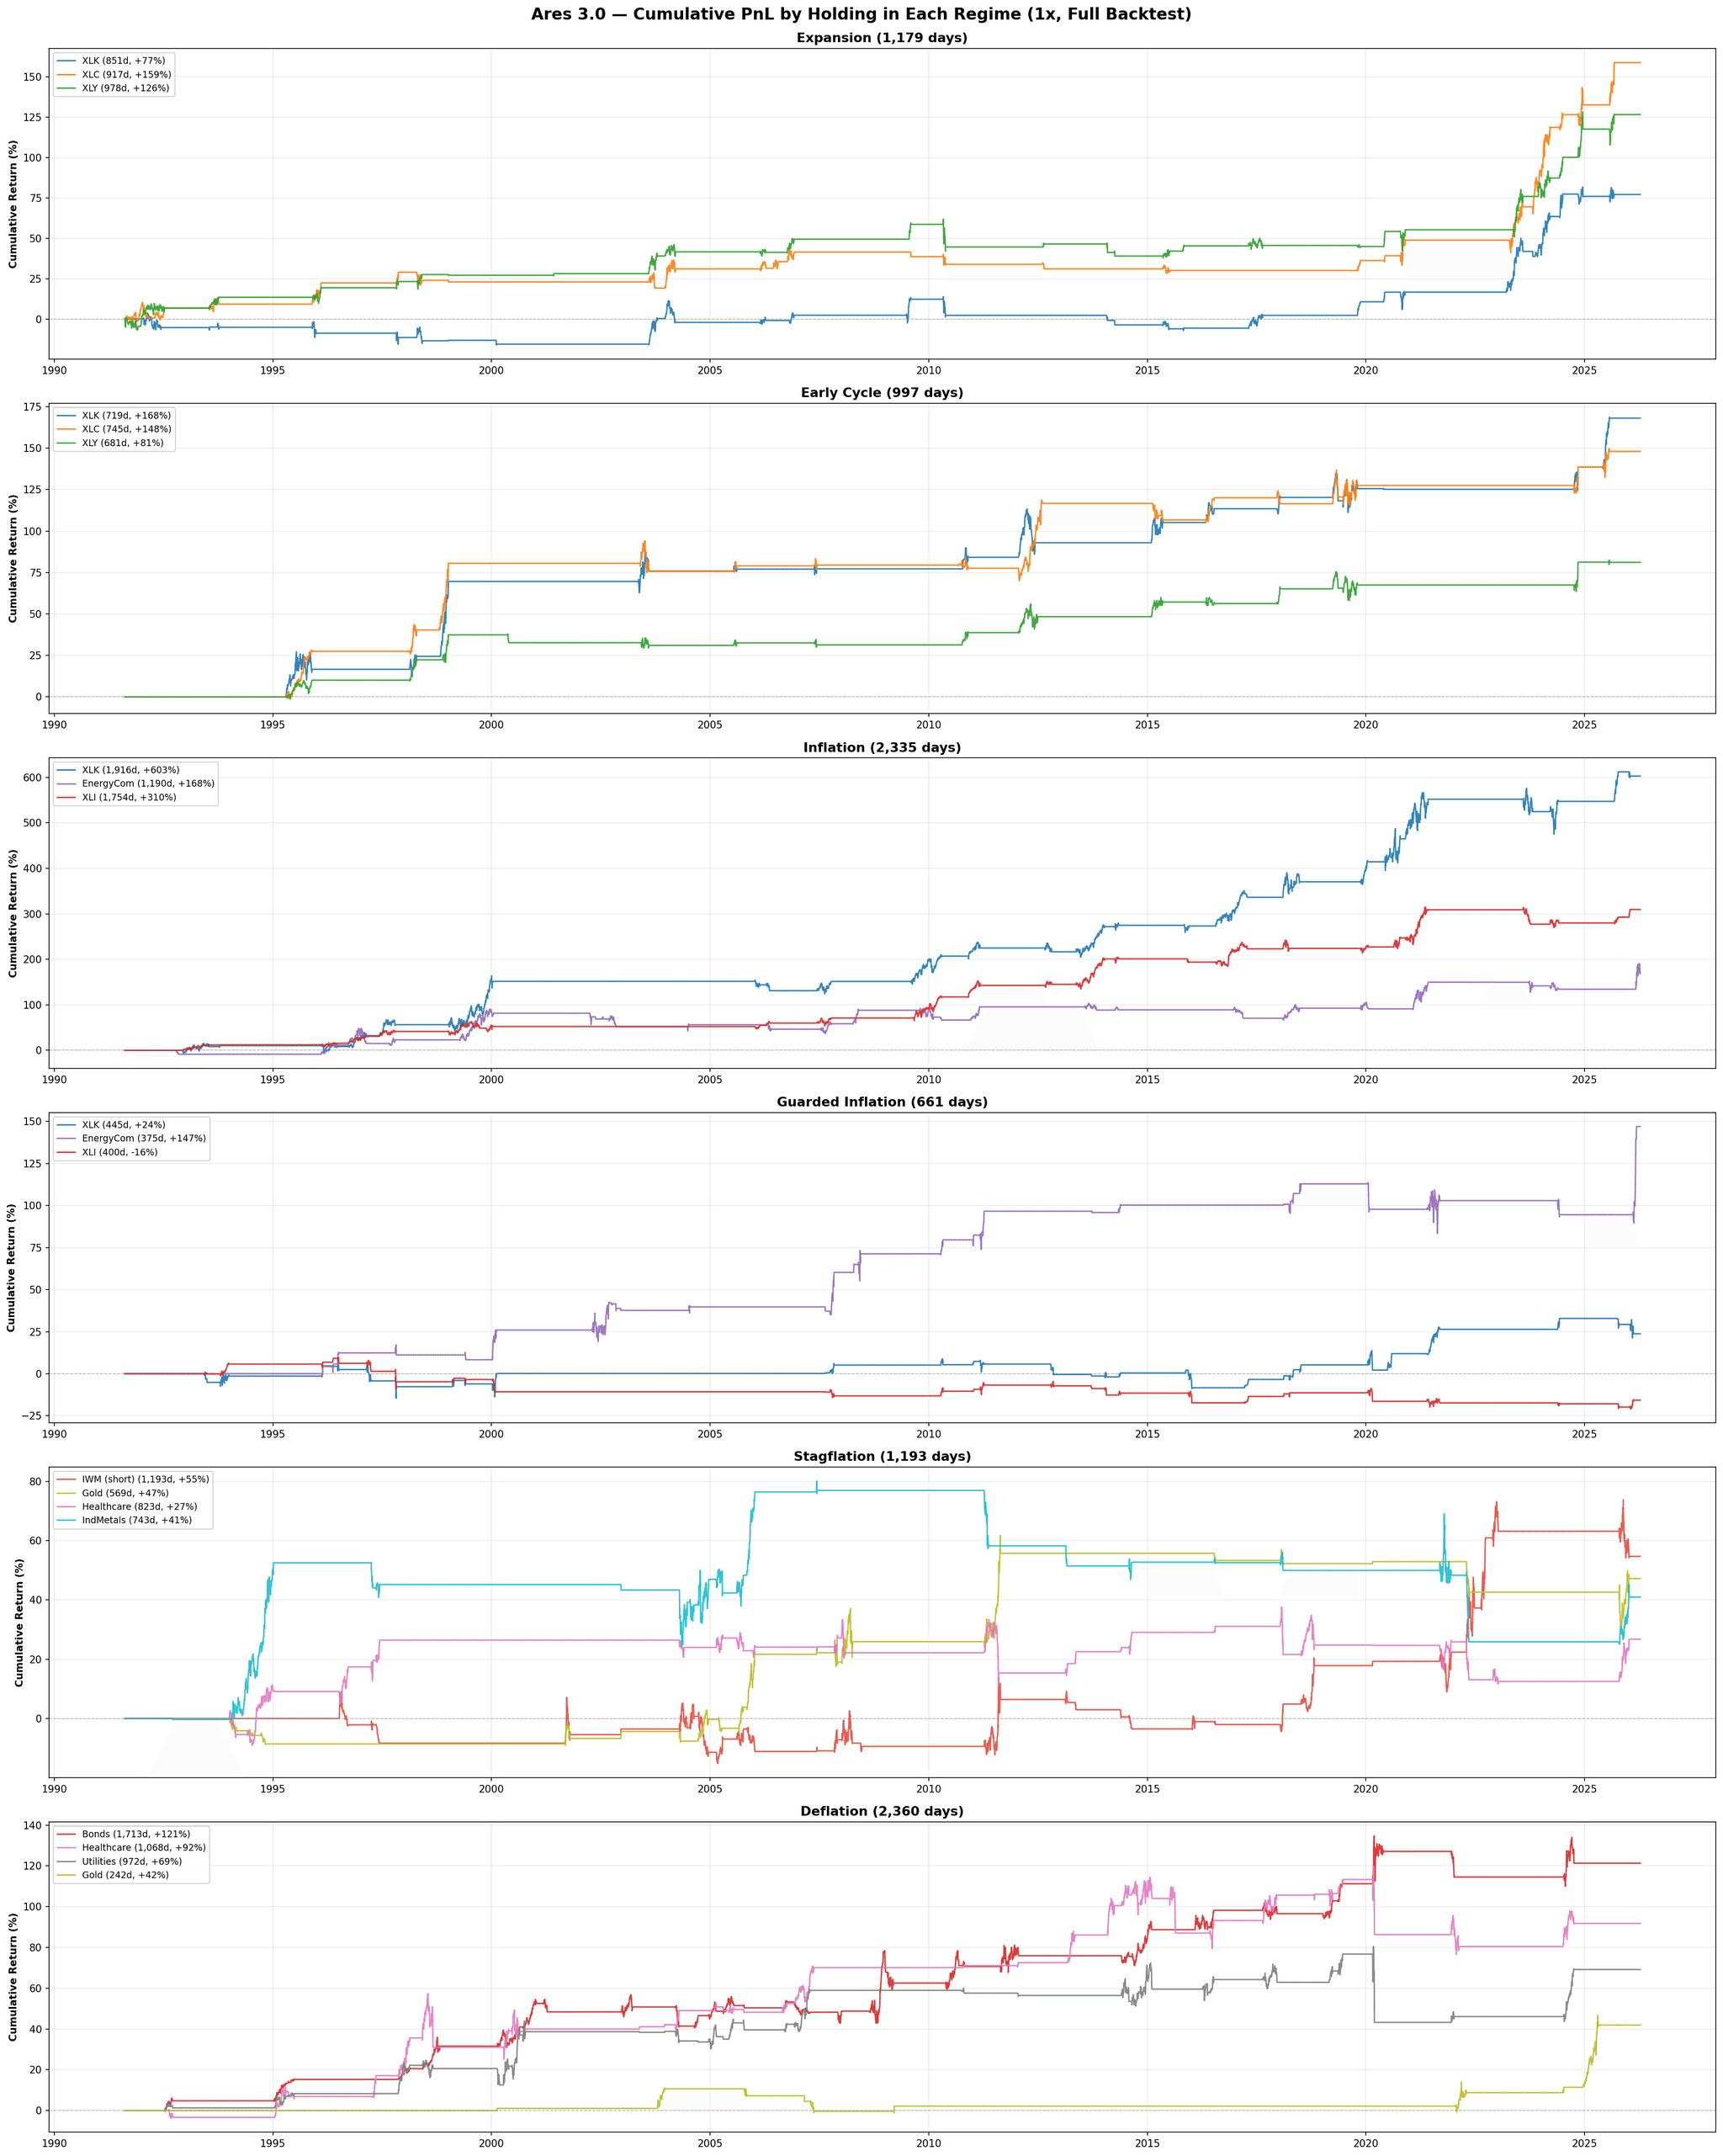
Here are some more interesting charts to better understand what to expect with Ares 3:
The charts below show the cumulative returns of each individual holding, broken out by regime, so you can see what to expect from each piece of the portfolio. Stagflation is the wild card. We've tested all kinds of holdings and haven't found one that consistently performs.
The Russell 2000 (IWM) short we added has been the most consistently profitable holding since 2015. Shorting the companies that get hit first in a recession adds protection and significantly lowers stagflation volatility. Shorting isn't always available in certain account types, but the long-only holdings carry their weight, too.
Stagflation is not the regime to take risks. Opportunities are slim, volatility is high, and the regime doesn't add much to the overall cumulative return. That's why we stay unlevered in Stagflation.
Drawdown Depth vs Recovery Time
Every dot on this chart is a single drawdown event, plotted by how deep it went (x-axis) and how many trading days it took to recover (y-axis). Ares V2.0 has multiple clusters of dots in the -40% to -45% range with recovery times stretching from 300 to over 450 trading days, meaning more than a full year and a half underwater. Ares V3.0 sits almost entirely in the -5% to -30% band with recovery times concentrated well below 200 days. The worst thing we can say about Ares V3.0's drawdown experience is "unpleasant for a few months."

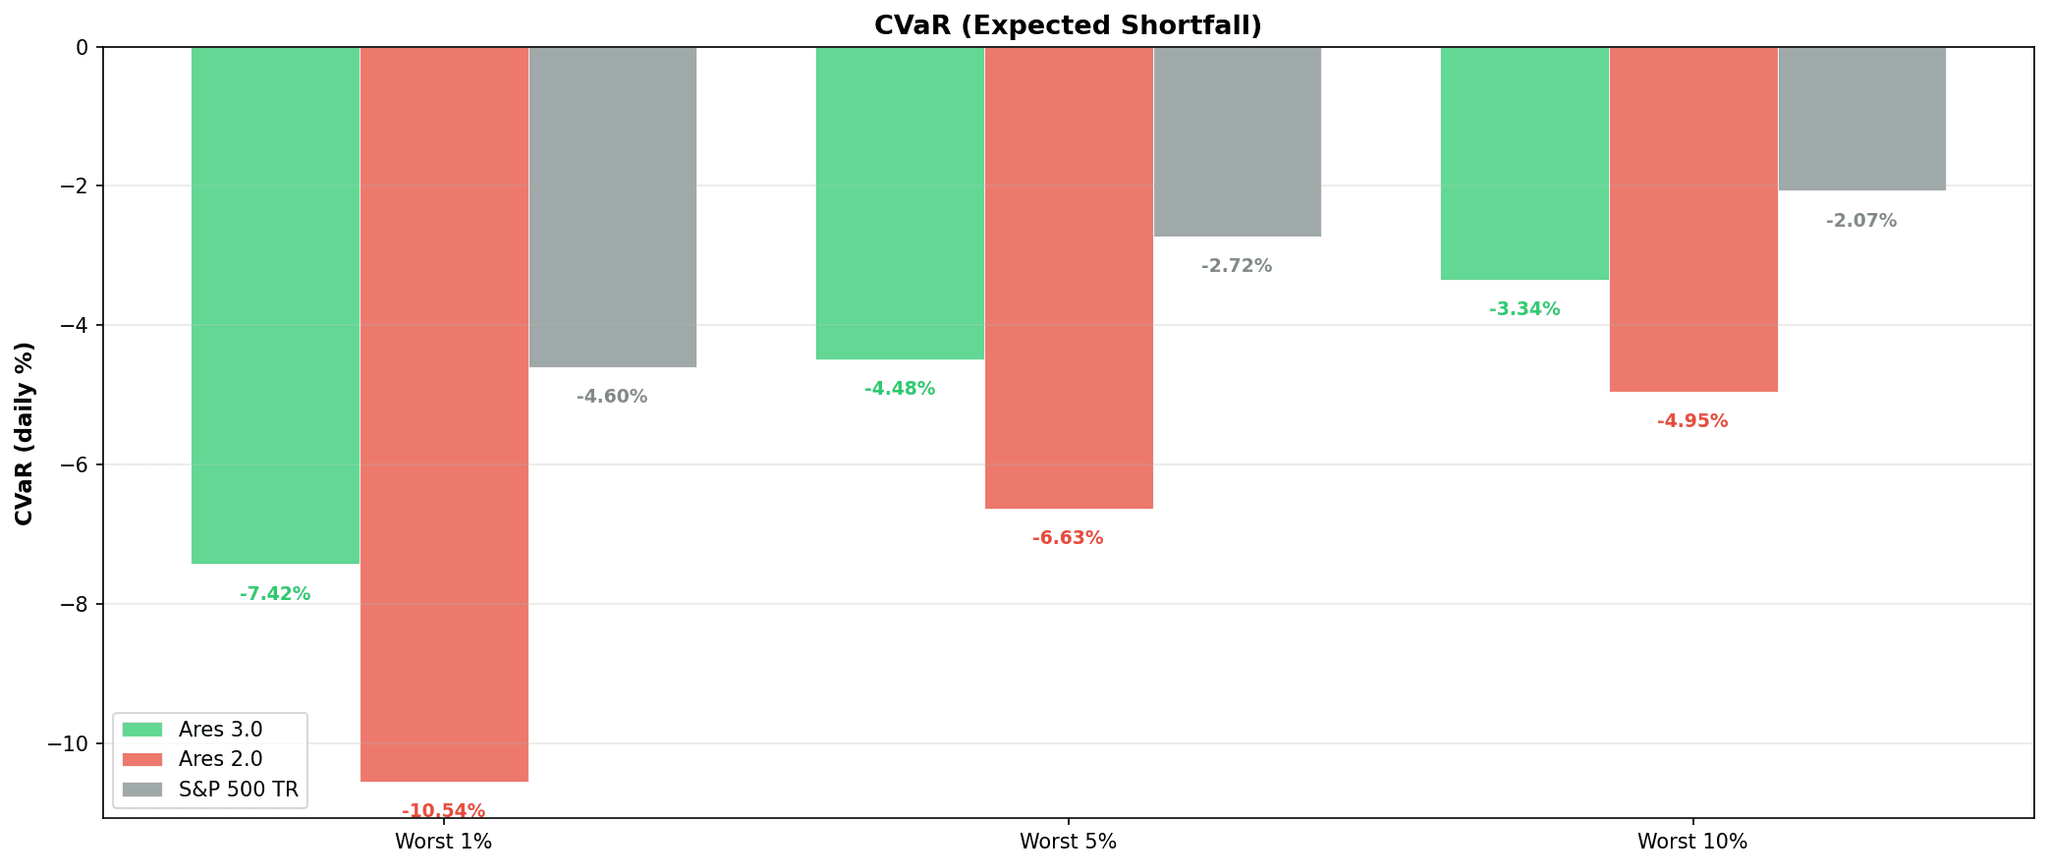
CVaR (Expected Shortfall)
Conditional Value at Risk is the average return on your worst N% of days, and it tells you what happens when things go wrong. On the worst 1% of days, Ares V3.0 loses an average of about 7% while Ares V2.0 loses about 10%, a three-point gap that compounds into a fundamentally different experience over a 34-year holding period. The gap holds at the 5% and 10% thresholds as well, meaning it is not a single catastrophic day driving the difference. This is the tail risk metric that matters for leverage.
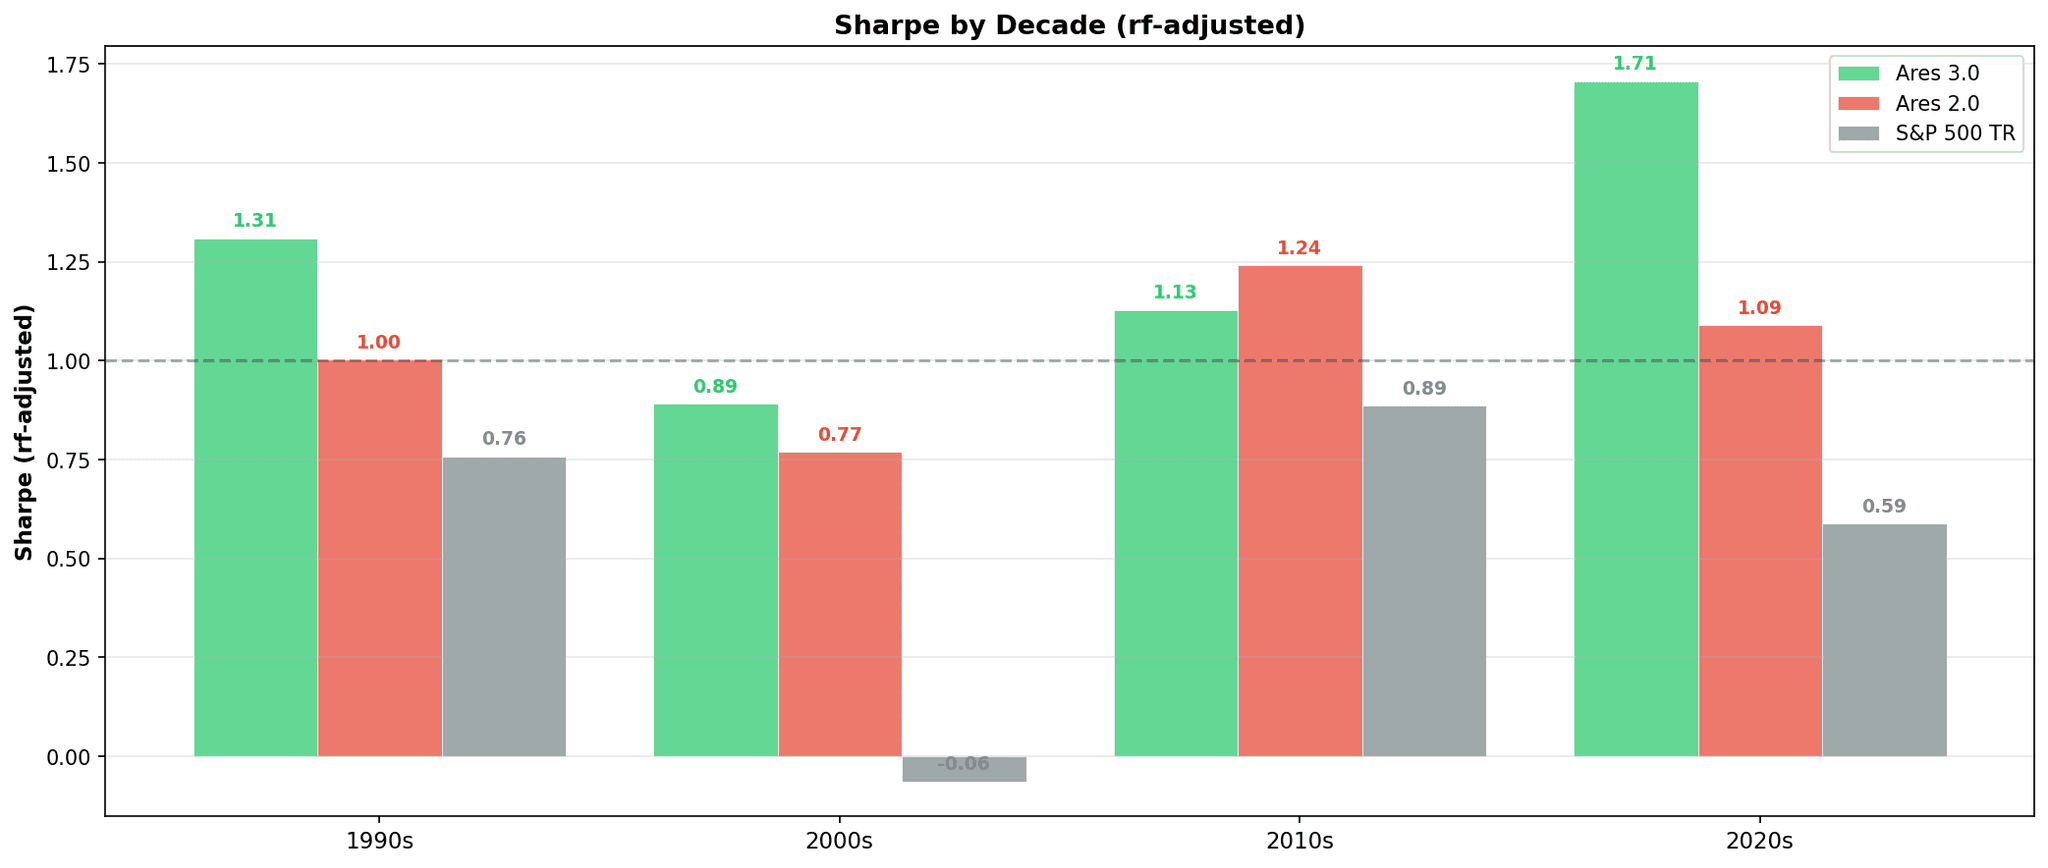
Sharpe by Decade
This splits the full backtest into four decade buckets and computes each strategy's Sharpe separately within each one. Ares V3.0 wins the 1990s decisively, essentially ties the 2000s, matches the 2010s, and dominates the 2020s. There is no decade in which Ares V2.0 meaningfully outperforms Ares V3.0 on a risk-adjusted basis, which is the definition of an edge that holds across regimes. If the new strategy only worked in certain market environments, you would see at least one decade where the old strategy pulled ahead.
Average 10-Day Return After Regime Transition
Every time the macro regime flips from one state to another, this chart shows what each strategy returned on average over the next 10 trading days. Regime transitions are where systematic strategies get caught flat-footed, because the old playbook stops working before the new one kicks in. Ares V3.0 outperforms Ares V2.0 on nearly every transition type shown, with the biggest gaps on the INFL→STAG and STAG→INFL transitions, where the new strategy handles the regime rotation cleanly. The takeaway is that the cost of switching regimes has dropped materially. Ares V3.0 adapts to the new environment faster than V2.0, which is where a large portion of its risk-adjusted edge ultimately comes from, we can essentially find the pivot points in momentum sooner.

Ares V3.0 is the new standard. Going forward, this is the version we'll be publishing signals for and tracking inside RQF. Ares V2.0 was a remarkable model, but the volatility profile was the one piece we were never fully satisfied with, and V3.0 is the answer we've been working toward for months.
We're running this with real capital, tracked daily in the QuantBase for every member to see. Ares V3.0 is live, and we think it's the best thing we've ever built.
MOST POPULAR
Unlock Premium Content
The remainder of this content is available to Radar members only. Subscribe to gain instant access.
$65/month
Billed annually at $780 (Save $120)
Access Models which boast 40%+ average yearly returns
Automated Portfolio Signals (RQF Strategy)
Live Calls with experienced traders
QuantBase Dashboard with macro regime models
DDAP TradingView Indicator
Real-time portfolio updates
Private Discord Channels
Lifetime Price Lock|Instant Access